Abstract
The growth and instability in the area, production and yield of cotton in Maharashtra was analysed for pre liberalisation and post liberalisation period. The growth behaviour of area, production and productivity of cotton was studied for sixty years (1960-60 to 2019-20). Compound growth rates were estimated with the help of exponential growth model. However, instability in the area, production and yield of cotton was worked out by estimating Cuddy Della Valle instability index. The results revealed that the area, production and productivity of the cotton increased significantly after the post liberalisation period. A significant increase in production and productivity of cotton was noticed in the state after adoption of Bt cotton varieties. Yield improvement was the primary reason behind the phenomenal growth in the cotton production. Second sub-period of the study showed more fluctuations in production and productivity of cotton. Area of cotton was found to be steadier than production and productivity. Though, adoption of Bt hybrids enhanced the cotton productivity in the state but, it was associated with moderate instability.
Introduction
Cotton, the leading cash crop in India plays a significant role in the Indian agriculture. Many rural families and smallholder farmers in the country depend on the cotton to sustain their livelihood (Hazell, 1982; Della, 1979). It provides basic raw material to the textile industry. Cotton is referred as the backbone of the textile industry. It contributes significantly to agriculture and industry in terms of farm income, employment and export earnings. Cotton provides valuable by-products like lint, oil, seed meal, hulls and biomass (Chand and Raju, 2008). It has huge demand from the industry side, and hence it is also called as White Gold (Mehra, 1981).
By occupying significant contribution in area (120.69 lakh Hectares) and production (362.18 lakh bales), India became the largest producer of cotton in the world. However, India occupied 38th rank with a productivity of 510 kg per hectare during 2021-22. In the case of cotton export, India occupied the third position with 5.5 million bales. Maharashtra, Gujarat, Andhra Pradesh, and Telangana are the important cotton growing states in India. These states are collectively known as the Cotton Basket of India due to its significant share in the cotton production.
The state of Maharashtra has 32 per cent area under cotton (39.37 lakh ha) and contributes around 24 per cent of its production (89.86 lakh bales) in the country. Hence, the long-term performance of the cotton crop in Maharashtra state was studied by estimating the compound growth rate and instability in the area, production and productivity of cotton at the state level.
Material and Methods
The present study was carried out in Maharashtra state. It was based on secondary data collected from various issues of Statistical Abstracts of Maharashtra State (Plate 1) published by Directorate of Economics and Statistics, Maharashtra and online data bank of Economic and Political Weekly and International Crop Research Institute for Semi-Arid Tropics. Data were collected for the period of sixty years from 1960-1961 to 2019-2020. The study period was further categorized into two sub-periods; the first period represents the pre liberalization period (1960-61 to 1989-90) and the second period represents the post liberalization period (1990-91 to 2019-20).
Growth rates
The compund growth rates were estimated with the help of exponential model assuming additive error terms.
Yt = constant *(1+CGR)t +et
Where,
Yt is the time series data for area / production / yield for year t,
t is the time trends for years of interest,
et is the error term and
CGR is the compound growth rate for the period under consideration.
The data were smoothened with the help of three-year central moving average techniques to remove bias from the data induced by the outliers (Sawant, 1983).
Instability
Instability in area, production and productivty of the cotton was studied by estimating Cuddy Della Valle Index. It is a modification of the coefficient of variation and found superior over other methods (Cuddy and Valle, 1978). It is calculated with the given formula:
Where,
Ix = Instability index
SEE = Standard error of the trend line estimates
= Average value of the time series data
The growth and instability in area, production and productivty of the cotton was estimated by using Statistical Analysis System (SAS) software

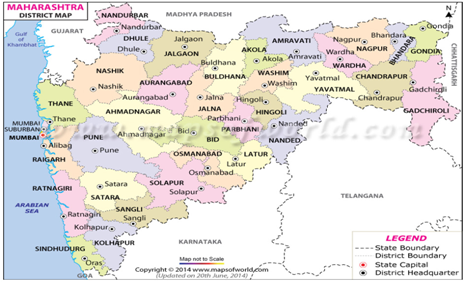
Plate 1 Map of Maharastra State
Results and Discussion
The long-term performance of the cotton in Maharashtra was evaluated with the help of two variables i.e. growth and instability in the area, production and productivity of cotton.
Growth rates
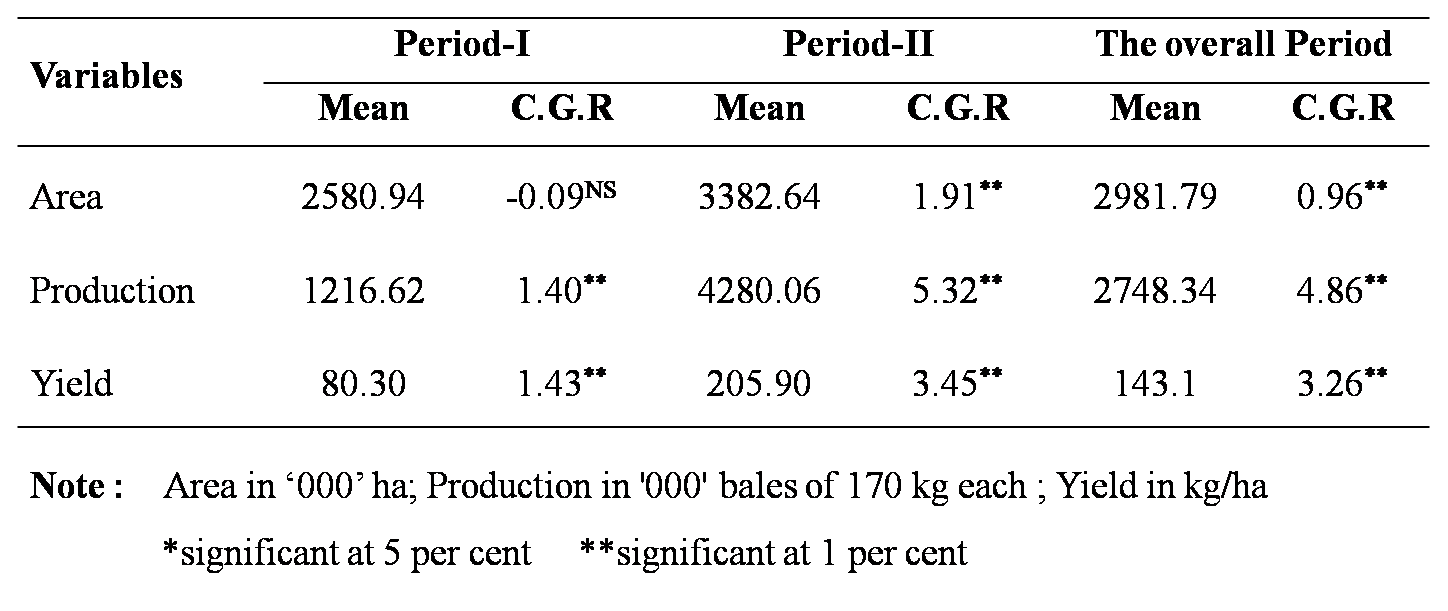
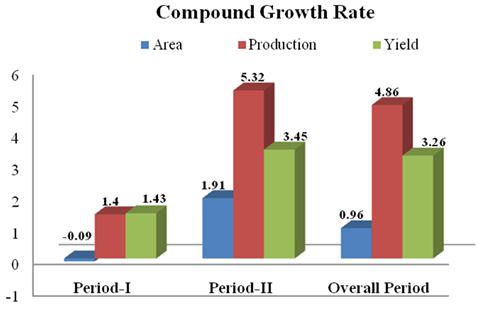
Table 1 and Fig. 1 presented the mean value and compound growth rates of the area, production and yield of cotton in Maharashtra. The area of cotton increased from 2580.94 thousand hectares to 3382.64 thousand hectares during two sub-periods, respectively in the state. However, the area of cotton showed an expansion of 2981.79 thousand hectares in the entire study period. In the case of production, it was 1216.62 thousand bales during the first period, which was further increased to 4280.06 thousand bales during the second period. The average cotton production was 2748.34 thousand bales during the overall period. Average productivity of cotton was improved after the adoption of Bt Hybrids cotton. Average yield of cotton was raised to 205.90 kg per hectare during the second period from initial yield of 80.30 kg per hectare in during the first period. During the overall period of the study, the yield of cotton was 143.1 kg per hectares. Thus, the second period revealed enhancement in the area, production and yield of cotton in Maharashtra improved over the first period.
The area of cotton showed non-significant growth in the first period while it grew @ 1.91 per cent and 0.96 per cent in the second and the overall period, respectively. The growth in the second and the overall period was significant by 1 per cent level of significance. Small farmers of the Maharashtra preferred the cotton crop in their cropping pattern due to their profitability over another competitive crop. It was the primary reason behind expansion in the cotton area.
Likewise, cotton production showed significant growth in production as it registered growth rate of 1.40 per cent and 5.32 per cent in the first and second periods. The significant growth in the cotton production by 1.40 per cent was mainly due to significant productivity improvement by 1.43 per cent in the first period as area growth was non-significant. However, the cotton production grew significantly by 5.32 and 4.86 per cent per annum, respectively during the second and the overall period. Improvement in productivity of cotton by 3.45 per cent per annum and area expansion by 1.91 per cent per annum in the second period led to significant positive growth of the cotton production in the state.
Yield improvement of the cotton by 3.26 per cent was the significant contributing factor as compared to area (0.96 per cent) during the entire study period. Average yield of cotton in Maharashtra during the first period increased by 1.43 per cent and by 3.45 per cent during the second period.
Table 1: Estimates of the compound growth rate of area, produc


Fig. 1 Compound growth rates of area, production and yield of cotton Instability
Instability
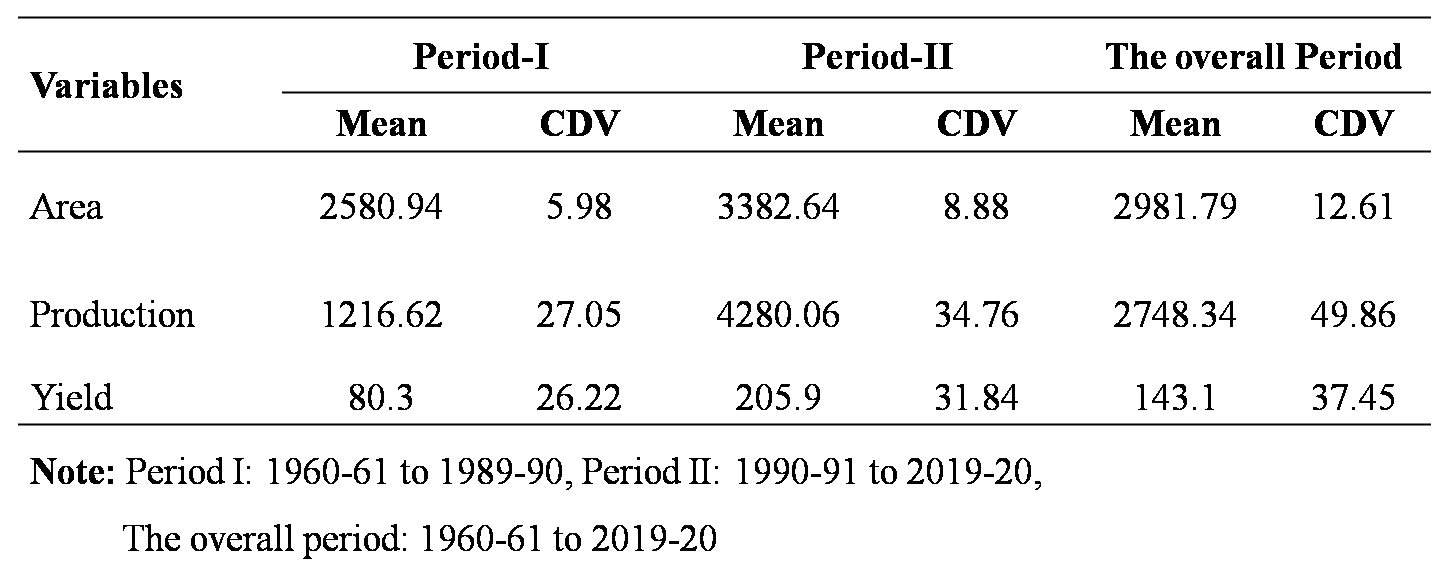
Table 2 and Fig. 2 presented the estimates of instability in area, production and yield of the cotton crop in Maharashtra state. Instability analysis showed that second sub-period of study revealed higher fluctuations in the area, production and productivity of the cotton as compared to the first sub-period. The yield of the cotton crop was more unstable compared to its area in both the sub-periods as well as during the entire study period. Instability in production and productivity of cotton was increased during the second sub-period of the study compared to the first sub-period. It was increased to 34.76 per cent from 27.05 per cent per annum in production. In regards to yield, instability was increased from 26.22 to 31.84 per cent per annum.
The values of CDV for area, production and productivity of cotton were 12.61, 49.86 and 37.45 per cent per annum, respectively during the entire study period. Production is an interaction of area and yield, so instability in yield and area was reflected in the production series. Thus, instability in cotton production was maximum compared to yield and area at the state level.
Table 2: Estimates of instability index of area, production and yield of cotton in Maharashtra


Fig. 2 Instability index of area, production and yield of cotton
Conclusion
The adoption of Bt hybrids technology led to significant expansion in the area, production and productivity of cotton in Maharashtra state. A significant growth in cotton production was accompanied with moderate instability (Ray, 1983). Bt cotton hybrids improved the cotton yield but, it also resulted in fluctuations in cotton yield. The significant growth in cotton production was mainly due to significant productivity improvement and area expansion.
References
Chand R and Raju S S. 2008. Instability in Indian Agriculture. National Centre for Agricultural Economics and Policy Research, New Delhi.
Cuddy J D and Valle P A. 1978. Measuring the instability of time series data. Oxford Bulletin of Economics and Statistics 40(1): 79-85.
Della Valle P A. 1979. On the instability index of time series data: A generalisation. Oxford Bulletin of Economics and Statistics 41(3): 247-248.
Hazell P B. 1982. Instability in Indian foodgrain production. Research report 30, International Food Policy Research Institute (IFPRI).
Mehra S. 1981. Instability in Indian agriculture in the context of the new technology. Research report 25, International Food Policy Research Institute (IFPRI).
Ray S K. 1983. An empirical investigation of the nature and causes for growth and instability in India. Indian Journal of Agricultural Economics, 38(4): 459-474.
Sawant S D. 1983. Investigation of the hypothesis of deceleration in Indian agriculture. Indian Journal of Agricultural Economics 38(4): 475-496.
Copyright
Open Access This article is licensed under a Creative Commons Attribution 4.0 International License, which permits use, sharing, adaptation, distribution and reproduction in any medium or format, as long as you give appropriate credit to the original author(s) and the source, provide a link to the Creative Commons license, and indicate if changes were made. The images or other third party material in this article are included in the article’s Creative Commons license, unless indicated otherwise in a credit line to the material. If material is not included in the article’s Creative Commons license and your intended use is not permitted by statutory regulation or exceeds the permitted use, you will need to obtain permission directly from the copyright holder. To view a copy of this license, visit http://creativecommons.org/licenses/by/4.0/.

