Effect of vegetable farming on poverty status and livelihood of farming households in Bosso and Chanchaga local government areas, Niger state, Nigeria
Abstract
This study examines the effect of vegetable farming on the poverty status and livelihood of farmers in Bosso and Chanchaga Local Government Areas of Niger State, Nigeria. The study describes the socio-economic characteristics of vegetable farmers, determines their poverty and livelihood status, and evaluates the profitability of vegetable farming. A sample size of 152 farmers was randomly selected, and data were obtained through structured questionnaires administered via the Kobo Toolbox. Data analysis was carried out using descriptive statistics, the United States Department of Agriculture (USDA) poverty index, the livelihood index, logit regression, and multiple regression models. The results show that 48.7% of respondents were between 41-50 years, while 28.9% were below 31 years. Additionally, 53.3% of the farmers were classified as poor, while 46.7% were non-poor. In terms of livelihood, 44.7% of respondents had a moderate livelihood, while 30.9% had a high livelihood status. Cost and return analysis indicated that vegetable farming is profitable, with an estimated total cost of ₦66,170.50, an average net income of ₦32,567.50, and a gross margin of ₦39,097.00 per production cycle. The major constraints faced by vegetable farmers included high input costs (51.9%), limited farmland (47.4%), and poor road networks (42.8%). The study concludes that vegetable farming has the potential to alleviate poverty and improve livelihoods. It recommends the provision of subsidized farm inputs, improved rural infrastructure, and enhanced extension services to boost vegetable farming and improve farmers’ economic well-being.
Introduction
Agriculture is a major sector of Nigeria’s economy, engaging approximately 70% of the population and contributing significantly to the nation’s GDP (FAO, 2020). Vegetable farming, in particular, plays a crucial role in providing food security, income generation, and employment, especially in rural areas (Schreinemachers et al., 2018). Due to its short gestation period and high market demand, vegetable farming is considered an important avenue for poverty alleviation (Effiong et al., 2021).
Poverty is a condition where basic needs like food, clothing, and shelter are unmet, classified into absolute and relative poverty (Sulaiman et al., 2015). Over 70% of Nigerians live below the poverty line, with 52.4% of urban dwellers surviving on a dollar per day, indicating high levels of absolute and relative poverty (Remi et al., 2017). It results in low income, hunger, malnutrition, disease, and poor access to necessities, threatening human survival (Joseph, 2010; Moshin, 2019). Despite Nigeria's resource wealth, poverty continues to rise, leading to hopelessness (Oyebanjo et al., 2023). However, increasing vegetable production, from 15.76 million tonnes in 2021 to 16.09 million tonnes in 2022, has helped reduce poverty and created employment for rural women (Ogunbo et al., 2015; Sanusi et al., 2015).
From the beginning of human civilization, agriculture has become the main source of people's livelihood (Sanusi et al., 2015). However, the term livelihood can be used in many different ways. A livelihood in its simplest sense is a means of gaining a living. Livelihood patterns are changing rapidly in the world with respect to time and space. A livelihood comprises the capabilities, assets (including both material and social resources) and activities required for a means of living. A livelihood is sustainable when it can cope with and recover from stress and shocks and maintain or enhance its capabilities and assets both now and in the future, while not undermining the natural resource base (Jatto et al., 2021). Livelihood strategies include how people combine their income generating activities; the way in which they use their assets; which assets they chose to invest in; and how they manage to preserve existing assets and income (Jalapa et al., 2021).
Despite the potential of vegetable farming to improve economic conditions, many farmers still struggle with poverty due to challenges such as high production costs, lack of access to modern farming inputs, limited extension services, and poor infrastructure (Fadipe et al., 2014). Furthermore, there is limited empirical evidence on the extent to which vegetable farming impacts poverty reduction and livelihood improvement in Niger State. This study seeks to bridge this gap by examining how vegetable farming influences the socio-economic status of farming household in Bosso and Chanchaga Local Government Areas of Niger State, determine their poverty and livelihood status, estimate farming costs and returns, analyze the effect of vegetable production on poverty and livelihood status, and identify the major constraints they face.
The objectives of this study are centered on a comprehensive examination of vegetable farming and its socio-economic implications for farmers in the selected study area. Specifically, the study aims to describe the socio-economic characteristics of vegetable farmers to provide a contextual understanding of their demographic and economic conditions. It seeks to determine the poverty status of these farmers, offering insights into their economic well-being. In addition, the study assesses the overall livelihood status of the farmers, capturing the multifaceted aspects of their quality of life.
Another key objective is to estimate the costs and returns associated with vegetable farming, thereby evaluating its economic viability. The study further analyzes the effect of vegetable production on the poverty status of farmers, investigating its role as a poverty alleviation strategy. It also evaluates the impact of vegetable farming on the broader livelihood status of the farmers. Finally, the study aims to identify the major constraints that hinder the productivity and sustainability of vegetable farming in the area.
Material and Methods
Study area
The study was conducted in Bosso and Chanchaga Local Government Areas of Niger State, Nigeria. The region has a predominantly agrarian economy, with vegetable farming being one of the major agricultural activities. The climate and soil conditions in the study area support the cultivation of various vegetables, including tomatoes, peppers, spinach, and onions (FAO, 2021).
Sampling Procedure and Data Collection
A multistage sampling technique was adopted. The first stage involved purposive selection of one (1) Local Government Area from Agricultural zone II namely: Bosso Local Government Area of Niger State for the study because of the presence of higher producers/farmers of vegetables in the study area. Second stage; was random selection of six (5) villages from Bosso Local Government Area namely; Lapai Gwari, Garatu, Dama, Gidan Mangoro and Gidan kwano. In all, a total of two hundred and two (202) vegetable farmers were sampled. The third stage involved the use of Yamane formula for appropriate sample size determination as reported by Eboh (2009) and Adopted by (Ojo, 2013).
 ---------------(1)
Where:
n= Sample size
N=Population size
e = Level of precision, taken to be 5%.
1 = Constant
Structured questionnaires were used to collect primary data, focusing on farmers' socio-economic characteristics, farming practices, income levels, and constraints (Adams, 2016). Data collection was facilitated using the Kobo Toolbox.
Analytical Techniques
Descriptive statistics: Tables of frequency, mean and percentage were used to describe the socio-economic characteristics of the respondents such as the age, marital status, educational level, sex and income of household head; household size and expenditure.
Poverty measurement: The USDA poverty index was used to classify farmers as poor or non-poor. Poverty Measurement Model This was achieved using Foster-Greer Thorbecke (FGT) poverty index. The respondents were disaggregated into groups of poor and non-poor categories. Pα was used in analyzing poverty. The model (Pα) relates to different dimensions of the incidence of poverty (P0), depth of poverty (P1) and severity of poverty (P2). These was used for head count (incidence), depth and severity of poverty, respectively. The three measures was based on a single formula but each index puts different weights on the degree to which a household or individual falls below the poverty line. The mathematical formulation of poverty measurements as adopted by (Sallawu et al., 2016) is estimated as:
 α -------------------------(2.1)
Where,
pα= the weighted poverty index for the ith sub-group,
α = Foster-Greer- Thorbecke (FGT) index and takes on the values of 0, 1 and 2 for incidence, depth and severity of poverty measures respectively,
Z1 = the poverty line for ith sub-group,
q = the number of individuals below the poverty line,
N = the total number of individuals in the reference population,
Yij = the income of household j in the subgroup i,
Z - Yij = poverty gap of the ith household and
 = poverty gap ratio --------------------- (2.2)
The quantity in bracket is the proportionate shortfall of income below the poverty line.
 = the proportion of the population that falls below the poverty line.
This is called the head count or incidence of poverty.
If α = 0, then FGT measures the incidence of poverty,
If α = 1, then FGT measures the depth of poverty and
If α = 2, then FGT measures the severity of poverty.
In this study, the poverty status was defined on the basis of accrued income of the farmers; as a result, poverty line was defined on the basis of average income of the farmers per annum. Estimation of poverty based on the FGT index was used to disaggregate farmers’ households into poor and non-poor categories.
Livelihood Index: A composite index assessing access to income, food security, education, and health services. A livelihood status diversification index was created from the different livelihood diversification strategies adopted by the respondents to determine the livelihood diversification status, using the approach by Kimengsi et al. (2019) in calculating an index from the different livelihood diversification strategies. The index is specified as:
Index Ai  --------------------------(2.3)
Where;
Ai = Livelihood index
A1= the actual value of an indicator for the household.
Amin = the minimum value of the indicator for the entire data set.
Amax = the maximum value of the indicator for the entire data set.
Net farm income: Farm budgeting technique was used to estimate the costs and returns of vegetable farmers in the study area. The net farm income model is specified as the equation below.
NFI = GR – (TFC+TVC) ------------------------(2.4)
NFI = Net farm income (₦);
TFC = Total fixed costs (₦); and
TVC = Total variable costs (₦).
GM = GFI – TVC ------------------------------- (2.5)
 ---------------------------------------(2.6)
GI= Gross margin (₦);
TVC = Total variable cost (₦).
 -----------------------------------------(2.7)
Where:
OR = Operating Ratio;
TVC = Total Variable Cost; and
GI = Gross Income.
Gross ratio: It measures the ultimate solvency of the farm business.
 ----------------(2.8)
Where:
GR = Gross Ratio;
TFE = Total Farm Expenses; and
GI = Gross Income. A lower and less than one ratio is preferable.
Logit Regression: Used to determine the impact of vegetable farming on poverty status. Logit regression model was used determine the socio-economic and institutional factors influencing the poverty status of the respondents. The model is mathematically represented as:
Implicitly, the model is stated as
Y = f( X1,X2 ……………………….Xn) ------(2.9)
Explicitly it was expressed as:
Y = β0 + β1 + β2 + β3 + β4 + β5 + β6 + β7 + ………………………β15 X15+ e
Where;
Y= Poverty status (poor = 1, non-poor = 0)
X1= Age of farmer (years)
X2 = Sex (male = 1, female = 0)
X3= Marital status (married = 1, single = 0)
X4= Household size (Number of persons per household)
X5= Level of education (years)
X6= Off-farm income (₦)
X7= Years of farming experience (years)
X8= Farm size cultivated (hectares)
X9= Land o
Multiple Regression: Applied to evaluate the effect of vegetable farming on livelihood status. The data was fitted into four (4) functional of linear, semi log, cobb-Douglas and exponential. The lead equation was chosen based on coefficients of multiple determination (R2 value), statistical significance of estimated regression coefficient, size of estimated regression coefficient, as well as the F ratio.
The explicit form of the functional forms are specified in the equation
Where:
Linear:  ------- (2.10)
Double-log:  -------- (2.11)
Exponential:  ---------- (2.12)
Semi-log:  -----(2.13)
Cs= Dependent variable
X1-X13= Independent variables
 = Parameters to be estimated
e= error term.
Where;
Y = Annual income (₦)
X1 = Farm size (hectare)
X2= Labour usage (man day)
X3= Cost of agro-chemicals (₦)
X4 = Cost of seed (kg)
X5= Cost of fertilizer (₦)
X6= Age (years)
X7= Household size (number)
X8= Education (years)
X9= Experience in vegetable farming (years)
X10 = (number)
X11 = Amount of credit accessed (₦)
X12 = Extension contact (number)
X13 = Cooperative membership (years)
βo = constant
β1 – β13 = coefficients of the independent variables
X1 – X13 = independent variables
Ui = Error term
ln = Natural log
Results and Discussion
Socio-economic Characteristics of Farmers
The study found that 48.7% of vegetable farmers were aged between 41-50 years, while 28.9% were below 31 years. The majority (83.6%) had household sizes of fewer than six members. Regarding farming experience, 56.6% had between three and six years of experience. Furthermore, 58% of respondents were members of cooperatives, and 40.8% had access to agricultural extension services (Adedoyin & Jibowo, 2005).
Findings from Fig. 1, indicated key aspects of cooperative membership, extension access, and land acquisition methods among vegetable farmers in the study area.
Cooperative membership shows that only 39.5 percent of farmers belong to a cooperative, while 60.5 percent are non-members. This indicates low participation in cooperatives, which may limit farmers' access to credit, inputs, and market information. Extension access is also low, with 82.9 percent of respondents reporting no access to extension services, while only 17.1 percent had received extension support. This lack of extension access may hinder farmers from adopting improved practices and increasing productivity.
The number of extension visits was also analyzed. a total of 82.9 percent of farmers reported receiving no extension visits. Only 9.9 percent had two visits, 3.3 percent had three visits, and 3.9 percent had five visits, this shows poor extension coverage, which can negatively impact farmers’ knowledge and productivity. Land acquisition methods indicate that 65.3 percent of farmers inherited their farmland, making it the dominant method of land acquisition. Other methods include borrowing at 12.5 percent, renting at 9.9 percent, and purchasing at 3.3 percent. The reliance on inheritance and borrowing suggests that many farmers lack secure land ownership, which may limit their ability to invest in long-term improvements.
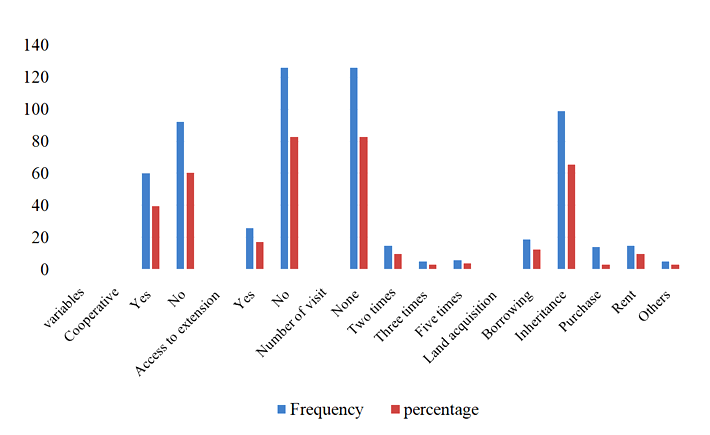
Fig. 1: Distribution of vegetable farmers according to cooperative membership, access to extension and land acquisition (n=152). (Source
Poverty status
Poverty remains a significant challenge among vegetable farmers in the study area. Fig. 2 presents the distribution of respondents based on their poverty status. The study found that a frequency of 81 respondents (53.3 percent) were classified as poor, while a frequency of 71 respondents (46.7 percent) were non-poor. This implies that more than half of the vegetable farmers in Bosso and Chanchaga LGAs are living below the poverty line, indicating a high level of poverty in the region. The poverty line was established at ₦52,471.45, calculated as two-thirds of the mean per capita income of the sampled farmers. The poverty incidence (or headcount ratio) was 0.5328, meaning that 53.3 percent of the sampled farmers were below the poverty threshold. The study also analyzed the poverty gap, which was 0.2017 (20.2 percent), implying that the average income of poor farmers must be increased by 20.2 percent to lift them out of poverty. Furthermore, the poverty severity index was 0.1042 (10.4 percent), indicating that not only are many farmers below the poverty line, but there is also significant income inequality among them. The severity index accounts for the depth of poverty and the degree of disparity among poor farmers. These findings contrast with Pelemo et al. (2020), who reported that poverty was only prevalent among a small proportion of farmers in North-Central Nigeria. This discrepancy could be attributed to differences in farm productivity, access to resources, and policy interventions in different locations.
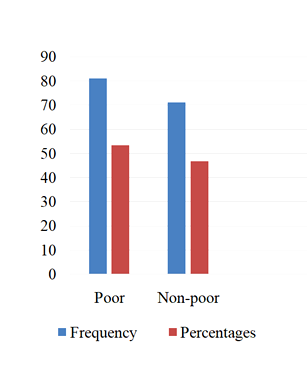
Fig. 2: Disribution of respondents based on their poverty status (n=152). (Sources: Field surve
Effect of vegetable farming on poverty status
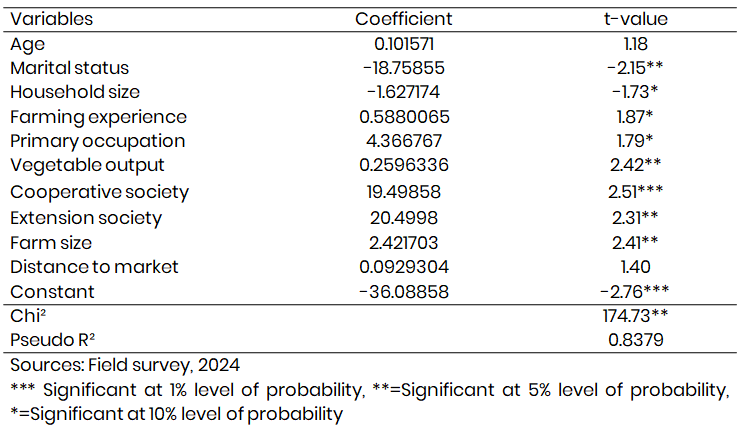
The impact of vegetable farming on poverty reduction was further analyzed using a logit regression model, as presented in Table 1. The results indicate that several socio-economic and farming-related factors significantly influence poverty status among vegetable farmers. Marital status (-0.6582836, p<0.01) had a negative and significant effect on poverty status. This implies that married farmers are less likely to be poor compared to single farmers, possibly due to household income pooling and shared economic responsibilities. Household size (-0.0571015, p<0.10) had a negative effect on poverty status, meaning that as household size increases, poverty tends to decrease. This could be due to the availability of more labor for farm work, leading to higher productivity and income generation. Farming experience (0.0198272, p<0.10) was positively significant, meaning that as farmers gain more experience, their likelihood of being poor increases slightly. This contradicts expectations and suggests that longer farming years do not necessarily lead to better financial conditions, possibly due to low mechanization, outdated farming practices, or decreasing land productivity over time. Primary occupation (0.1532406, p<0.10) was also positively significant, indicating that farmers who rely solely on vegetable farming struggle financially due to fluctuating market prices, post-harvest losses, and lack of diversification into other income sources. Vegetable output (0.0091112, p<0.01) was positively correlated with poverty status, meaning that increased production does not necessarily reduce poverty. This might be due to factors like low market prices, high input costs, and exploitative middlemen who lower farmers' profits. Cooperative membership (0.684253, p<0.01) was positively significant, meaning that members of agricultural cooperatives had a higher probability of being poor. This could be due to ineffective cooperatives, mismanagement, or lack of real financial benefits from group affiliations. Extension services (0.7193884, p<0.01) had a negative impact on poverty, meaning that farmers with access to agricultural training, new technologies, and better farming techniques were less likely to be poor. This suggests that government and non-government organizations should strengthen extension services to improve farmers’ financial well-being. Farm size (0.0849835, p<0.01) was negatively related to poverty, implying that farmers with more land resources tend to be wealthier due to the ability to expand production and earn higher revenues.
Table 1: Effect of vegetable production on poverty status of farmers (n=152)
Livelihood status
The study assessed the livelihood status of vegetable farmers using a livelihood index, as shown in Fig. 3. The findings revealed that 24.34 percent of farmers had low livelihood (Index < 0.333), 44.74 percent had moderate livelihood (Index between 0.334 - 0.667), and 30.92 percent had high livelihood (Index > 0.667). The mean livelihood index (A1) was 0.5592, suggesting that most farmers fall within the moderate livelihood category. The minimum livelihood index (Amin) was 0.1112, and the maximum index (Amax) was 1.0000, indicating a wide disparity in livelihood conditions. These findings align with Mukaila et al. (2022), who reported that vegetable farming significantly improves rural livelihoods by providing steady income, food security, and employment opportunities. Using the USDA poverty index, 53.3% of vegetable farmers were classified as poor, while 46.7% were non-poor. Regarding livelihood status, 44.7% of respondents had a moderate livelihood, while 30.9% reported a high livelihood. These results suggest that while vegetable farming contributes to economic well-being, many farmers still face financial challenges (Akpan, 2010).
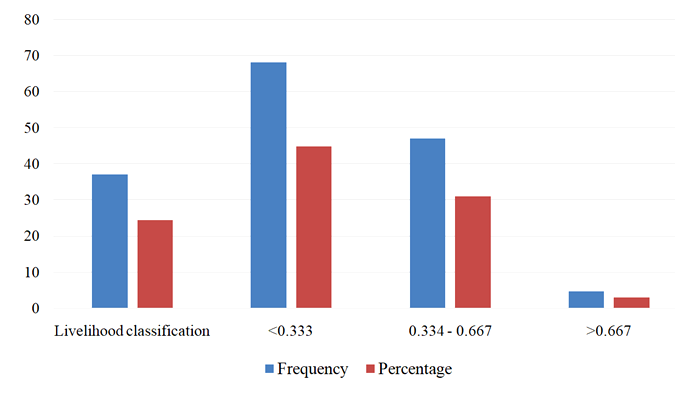
Fig. 3: Distribution of respondents based on their livelihood status (n=152). (Sources: Field survey, 2024)
Effect of vegetable farming on livelihood status
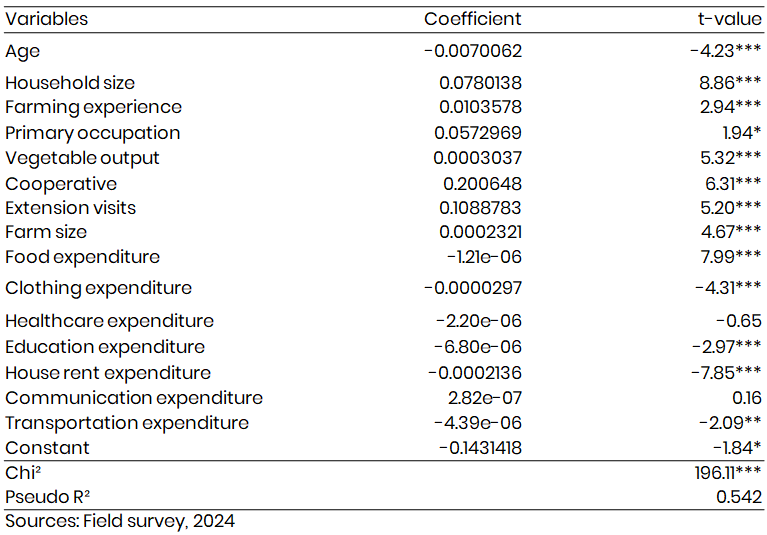
Table 2 presents the results of a multiple regression analysis that examined the impact of vegetable farming on livelihood status. The key findings include the following. Age (-0.0070062, p<0.01) had a negative and significant effect on livelihood status, meaning that older farmers had lower livelihood scores. This suggests that younger farmers are more productive, adaptable to new farming techniques, and willing to explore market opportunities. Household size (0.0780138, p<0.01) was associated with higher livelihood scores, likely due to more available labor for farm work and diversified sources of income within the household. Farming experience (0.0103578, p<0.01) was positively significant, implying that experienced farmers achieve better livelihood outcomes due to greater knowledge of market trends, improved production techniques, and better resource management. Primary occupation (0.0572969, p<0.10) showed that farmers engaged primarily in vegetable farming had higher livelihood scores, indicating that full-time vegetable farming can sustain livelihoods if properly managed. Vegetable output (0.0003037, p<0.01) was associated with improved livelihood status, suggesting that higher productivity contributes positively to financial well-being. Cooperative membership (0.200648, p<0.01) significantly improved livelihood status, as cooperatives provide better access to inputs, credit, and market linkages. Extension visits (0.1088783, p<0.01) had a positive effect on livelihood, reinforcing the importance of agricultural training and advisory services. Farm size (0.0002321, p<0.01) contributed to better livelihood status, supporting the idea that land ownership plays a critical role in economic stability. Expenditure factors such as increased spending on food, education, healthcare, and house rent were negatively significant, indicating that higher living costs reduce disposable income, affecting overall livelihood scores.
Table 2: Effect of vegetable production on livelihood status of farmers (n=152)
Profitability analysis
Cost and return analysis revealed that vegetable farming is profitable. The estimated total cost per production cycle which typically lasts between 8 to 12 weeks was ₦66,170.50, with an average net income of ₦32,567.50 per cycle and a gross margin of ₦39,097.00 (Fadipe et al., 2014). The gross ratio of 0.49 and operating ratio of 0.67. A gross ratio of 0.49 means that 49% of the total revenue is spent on production costs, leaving 51% as potential profit. The lower the gross ratio, the higher the profitability. A GR below 1 indicates that the business is financially viable, while a GR above 1 would mean the farm is running at a loss. The gross ratio of 0.49 indicates that vegetable farming in the study area is profitable, as only 49% of the revenue is used to cover total costs, allowing farmers to retain the remaining 51% as earnings. Also an operating ratio of 0.67 means that 67% of the revenue is used to cover variable costs, leaving 33% as earnings before fixed costs and profit considerations. A lower OR indicates better cost efficiency, meaning farmers can retain more income as profit. Since 67% of revenue is used for operational costs, only 33% remains for fixed costs and net earnings. The operating ratio of 0.67 shows that a significant portion of revenue (67%) is spent on variable costs, such as labor, herbicides, and insecticides, which are essential for production. Since the gross ratio is below 1, the farm remains financially sustainable. However, the high operating ratio suggests that reducing variable costs could increase profitability. Hence, it can be inferred that vegetable in the study area is profitable as vegetable farming generates substantial returns for farmers.
Constraints facing vegetable farmers
The findings from Fig. 4 indicates that vegetable farmers in the study area face multiple challenges that affect their productivity and profitability. The most significant constraints include the high cost of farm inputs, limited farmland, and poor road access. Other notable challenges include inadequate market access, pest and disease incidence, lack of storage facilities, and inadequate extension services. High cost of farm inputs was the most reported constraint, affecting 51.9 percent of farmers. This finding is consistent with Oluwasola (2015), who reported that rising production costs significantly hinder vegetable farming in Oyo state. The increasing prices of seeds, fertilizers, pesticides, and herbicides can be attributed to inflation, currency devaluation, and high import dependency, as highlighted by World Bank (2018). This makes it difficult for smallholder farmers to afford necessary inputs, leading to reduced yield and profitability. Limited farmland was reported by 47.4 percent of respondents, making it the second most critical challenge. Mukaila et al. (2022) found similar results, stating that farmland scarcity is a major constraint for vegetable farmers in Nigeria due to increasing population pressure and land conversion for residential and industrial purposes. The availability of arable land is crucial for increasing production capacity, and restricted access to land may limit expansion and mechanization. Poor road access was identified by 42.8 percent of the farmers as a significant challenge. Poor rural infrastructure affects transportation, increasing post-harvest losses and reducing farmers' access to markets. This finding aligns with Adekoya (2014), who emphasized that inadequate road networks increase production costs and discourage investment in vegetable farming. Without good roads, farmers struggle to move their produce to urban markets, leading to reduced earnings and increased wastage. Inadequate market access was reported by 26.9 percent of respondents. Marketing challenges such as price fluctuations, lack of storage, and middlemen exploitation have been widely documented in literature. Effiong et al. (2021) highlighted that smallholder farmers often have weak bargaining power, making them vulnerable to price manipulations by traders. Improving market linkages and providing storage facilities could help farmers sell their produce at better prices. Pest and disease incidence was a problem for 30.3 percent of farmers. This is consistent with Fadipe et al. (2014), who observed that inadequate pest control measures and climate change effects have increased pest outbreaks, leading to significant yield losses. Proper pest management training and subsidized access to pesticides could help farmers mitigate this challenge. Low technology adoption was reported by 21.1 percent of respondents this agrees with Mukaila et al. (2022), who noted that many vegetable farmers still rely on traditional farming practices, which limit productivity. Inadequate mechanization and lack of access to modern farming tools contribute to low efficiency. Inadequate extension services affected 13.2 percent of farmers, making it the least reported constraint. However, the importance of extension services in modernizing agriculture cannot be overstated. Ashagidigbi et al. (2018) reported that poor access to extension services limits farmers' knowledge of improved agronomic practices, leading to lower productivity. strengthening agricultural extension programs would enhance farmers' technical know-how and boost production.
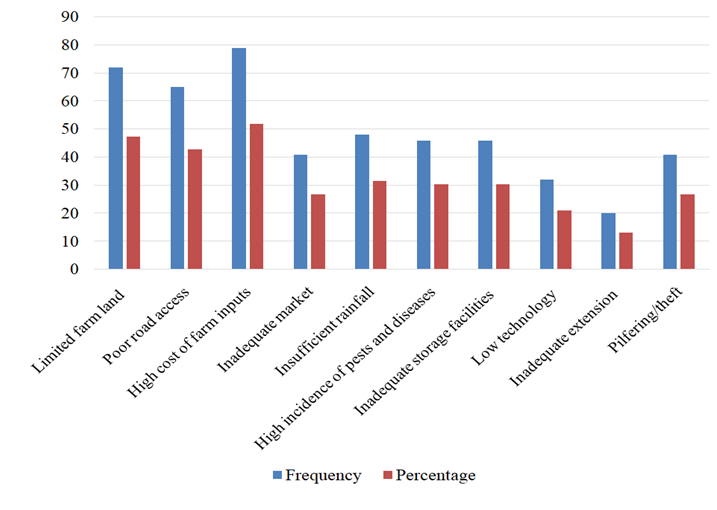
Fig. 4: Constraints facing vegetable farmers in the study area (n=152), (Sources: Field survey, 2024)
Conclusion
This study concludes that vegetable farming contributes significantly to income generation and livelihood improvement among farmers in Bosso and Chanchaga LGAs. However, despite its profitability, many farmers still experience poverty due to high input costs, poor infrastructure, and limited access to support services. The study also concludes that most vegetable farmers in the study area are in their active age, predominantly male, and married with small household sizes. A significant proportion of the farmers neither belong to cooperatives nor have access to extension services. More than half of the farmers live below the poverty line, and only a few enjoy a high livelihood status. Despite these challenges, the gross margin analysis confirmed that vegetable farming is a profitable venture. Several socio-economic factors significantly influenced vegetable production and poverty status. The coefficients of age, household size, farming experience, primary occupation, vegetable output, cooperative membership, extension visits, farm size, food expenditure, clothing expenditure, education expenditure, and household rent expenditure all had varying effects on vegetable production. Similarly, marital status, household size, farming experience, primary occupation, vegetable output, cooperative membership, extension services, and farm size were key determinants of poverty status. The major constraints faced by farmers were the high cost of inputs and limited access to farmland. The price of input should be subsidized for vegetable farmers in the study area, good road network should be provided for farmers in the study area and older farmers should be sensitized to embark on vegetable.
References
Adams, O. K. (2016). Economic impact of livestock production on the society: A case study of Ikare Akoko Ondo State. IOSR Journal of Agriculture and Veterinary Science, 9(12), 77–80.
Adedoyin, S. F., & Jibowo, A. A. (2005). Youth and children programmes in Nigeria. In Agricultural extension in Nigeria (p. 251). AESON.
Adekoya, A. E. (2014). The role of infrastructure in agricultural development: A Nigerian case study. Journal of Agricultural and Food Information, 15(3), 212–222. https://doi.org/10.1080/10496505.2014.888357
Adekunle, O. A., Adefalu, L. L., Oladipo, F. O., Adisa, R. S., & Fatoye, A. D. (2009). Constraints to youths’ involvement in agricultural production in Kwara State, Nigeria. Journal of Agricultural Extension, 13(1), 102–108.
Akpan, S. B. (2010). Encouraging youth’s involvement in agricultural production and processing. International Food Policy Research Institute, Abuja.
Copyright
Open Access This article is licensed under a Creative Commons Attribution 4.0 International License, which permits use, sharing, adaptation, distribution and reproduction in any medium or format, as long as you give appropriate credit to the original author(s) and the source, provide a link to the Creative Commons license, and indicate if changes were made. The images or other third party material in this article are included in the article’s Creative Commons license, unless indicated otherwise in a credit line to the material. If material is not included in the article’s Creative Commons license and your intended use is not permitted by statutory regulation or exceeds the permitted use, you will need to obtain permission directly from the copyright holder. To view a copy of this license, visit http://creativecommons.org/licenses/by/4.0/.

