Effects of irrigation water level on Bread Wheat at Qadalle scheme, Yabello district of Borana zone, Ethiopia
Abstract
The study conducted on the response of bread wheat yield and water use efficiency to six levels of irrigation ranging from 50% to 100%. The bread wheat variety, ETW9578, was used as the test crop. The experimental design consisted RCBD with three replications. The 12 m2 net plot size was received 100 kg ha-1 of NPS, and 150 kg ha-1 of urea. The relationship between water levels and the bread wheat yield was analyzed through various components including grain yield, plant height, tiller number, and above-ground biomass. This is supported by the results of an ANOVA, which provides statistical evidence to confirm the significant impact of irrigation levels on wheat production. Accordingly, the max (4751.46 kg ha-1) and min (2101.87 kg ha-1) yield recorded at 100% ETc and 50% ETc irrigation level respectively. These findings demonstrate that as irrigation approaches full crop water requirements, bread wheat are better able to meet their physiological needs, resulting in optimal growth and productivity. The number of productive tillers is crucial as it directly influences the number of grains per plant. Enhanced irrigation results in greater biomass accumulation due to improved photosynthesis rates facilitated by healthier plants. The data presented indicates that different irrigation levels have varying impacts on the thousand seed weight (TSW) of bread wheat. The highest TSW was observed at 60% ETc and 90% ETc irrigation treatments. This suggests that these levels provide sufficient moisture to support optimal seed development. However, there was no significant variation in yields among 70% and 80% ETc treatments. This indicates that both levels may be similarly effective for achieving satisfactory yields. Conversely, reducing the irrigation level from 90% ETc to 70% ETc does not significantly reduce yield but offers advantages in terms of water savings. This finding is critical as it suggests that farmers can maintain competitive yields while using less water, which is essential for sustainable agriculture. Based on the findings, applying an irrigation level (70% ETc) is recommended for optimum returns in wheat. This recommendation balances yield performance with efficient water usage, making it a practical approach for farmers aiming to enhance sustainability while maintaining productivity.
Introduction
Irrigated agriculture consumes the majority of the existing fresh water. Irrigation accounts for approximately more than 70% of total water abstraction and 60-80% of overall water usage (Ingrao et al., 2023). In order to feed 8 billion people by 2025, the irrigated agriculture should be doubled by more than 20% and the yield of irrigated crops improved by at least 40% (Senbeta and Worku, 2023). Improving agricultural water use efficiency is crucial to achieving this goal. Many studies have been undertaken to gather experience in watering crops to enhance performance, efficiency, and profitability, and water saving irrigation investigation will continue.
Agriculture's long-term water management and utilization has become a headache for scientists as well as for users. Acceptance of methods for saving irrigation water while keeping acceptable yields may help to preserve this increasingly scarce resource. In locations where water is a scarce resource, farmers may find that improving water productivity is more beneficial than boosting crop output. As a result, research should be established and carried out with the goal of increasing agricultural water productivity through various water-saving strategies in integration with the use of the correct scheme and farm structures (Yakubu et al., 2019).
The demand for wheat in Ethiopia is increasing faster than for any other food crops, particularly in urban areas. The gap between demand and supply is widening because of quickly increasing population number and changing preferences towards wheat-based food items. Conscious to the aforementioned facts, the Government of Ethiopia has already identified key priority intervention areas to increase productivity of small-scale farmers and expand large-scale commercial production of wheat. The top priorities identified include: development of small and large-scale irrigation schemes, financing effectual supply of agricultural inputs, improving agricultural production methods using mechanization, post-harvest loss reduction and natural resources management. Even though, government planned need to produce wheat crop by irrigation is high, there was no or little research work on irrigation water levels that gain high net return.
Among many restrictive factors water is the most common limiting elements in the agricultural production system, which is crucial for wheat growth and productivity. However, the optimal irrigation is not well identified, particularly in the study area. Therefore, this study was undertaken to determine the required irrigation water level that optimize wheat yield in Yabello district of Borana zone.
Material and Methods
Description of the study area
The study was carried out in Qadalle scheme, Yabello district of Borana zone of Oromia National Regional State. Yabello is the capital town of the Borana zone and situated south to Addis Ababa at a distance of 570 km. The Borana lowland is usually known as the southern rangelands. The Qadalle scheme is made from micro earthen dam collecting runoff water. Geographically, it is situated at 4°53'00"N to 5° 55' 09"N latitude and 38°5′ 00" Eto 40° 8′ 01"longitudes with an elevation ranging from 1550m to 1970m above sea level. The minimum and maximum temperature 19 to 24°C and annual mean rainfall is and 300 to1000 mm, respectively. The annual precipitation distribution is bimodal with 60% falling from April to May and 30% from October to November.
Experimental design and layout
The experiment was conducted for three consecutive years, at Qadalle irrigation scheme. The experimental field was ploughed, harrowed and human labor. The Experimental designed a factorial RCBD with three replications. The irrigation levels include (100% ETc, 90% ETc, 80% ETc, 70% ETc, 60% ETc and 50% ETc). The experimental field was divided in to 18 with the plot size of 3.6m × 5m (18m2) to accommodate 6 furrows with spacing of 60cm and having 4m length, consisting four ridges and five furrows for each plot. The blocks and plot had a buffer zone of 1.2m and 1.5m respectively from each other to eliminate influence of lateral flow of water. Field canal was constructed for each block to irrigate the field.
The bread wheat (ETW9578) variety seed was sown by drilling on both sides of the rows at a rate of 120 kg ha-1. For data collection and measurement, four central rows with a net plot size of 12 m2 were used. At time of seeding, all plots were given 100 kg ha-1 of NPS. 150 kg ha-1 was applied in splits form, half at 20 days after sowing and remaining half at 48 days after sowing. All cultural practices, other than treatment variables, were carried out according to the standard practices recommended for the area.
Discharge measurement
The irrigation water applied for each experimental plot was measured by 3-inch Parshall flume installed 10m away from the nearest plot along field canal. The calculated gross irrigation was finally applied to each experimental plots based on the treatments proportion. Volume of water applied for every treatment was determined from plot area and depth of gross irrigation requirement. Time required to irrigate each treatment was calculated from the ratio of volume of applied water to the discharge-head relation of 3-inch Parshall flume. Since discharge level might vary at field condition, time required was calculated at 15 cm head levels. The time required to deliver the desired depth of water into each furrow was calculated using the following equation.

Where: dg = gross depth of water applied (mm), t = application time (sec), A = plot Area (m2) and Q = flow rate (l/s).
Agronomic data collection
Plant height and dry matter were measured at harvest. The plant heights of 10 randomly selected plants per plot were measured from soil surface to the top covering of the plant. The same 10 random plant samples were oven dried for 72 hour at 68°C and the dry weight was recorded. The spike length excluding awns was also recorded. As the kernels matured, the crop in the harvest area of 6.3 m2 per plot (excluding border rows) was harvested and collected in clean sacks to record the weight. The harvested crop was sun-dried for three days and threshed separately using wooden sticks and finally the seed was separated, cleaned and weighed to record the grain yield for each plot.
The yield data used in this study were estimated using yield sampling methods. This was achieved by using the crop cut methods by demarcating a plot 3m × 3m in size. Then, followed by harvesting the produce from the plots, threshing, winnowing, and drying the produce, and later determining the dry weight. The weight of one thousand seeds per plot was recorded to 3 decimal places using a sensitive weighing balance.
Water Use Efficiency
The water use efficiency (WUE) was also calculated. The following Equation 1 was used to compute water use efficiency as a ratio of grain yield to total crop evapotranspiration (ETc) during the course of the growing season (Zwart and Bastiaanssen, 2004).

Where, WUE is water use efficiency (kg m-³), Y is crop yield (kg ha-1) and ETc is the seasonal crop water consumption by evapotranspiration (m³/ha).
Data analysis
Analysis of variance for the collected parameters was performed as per the methods described by Allison, (2001) using SAS computer software for randomized complete block design and treatment mean comparison is done by Fisher’s list significance difference (LSD) at 5%.
Results and Discussion
Soil physico-chemical properties of the experimental site
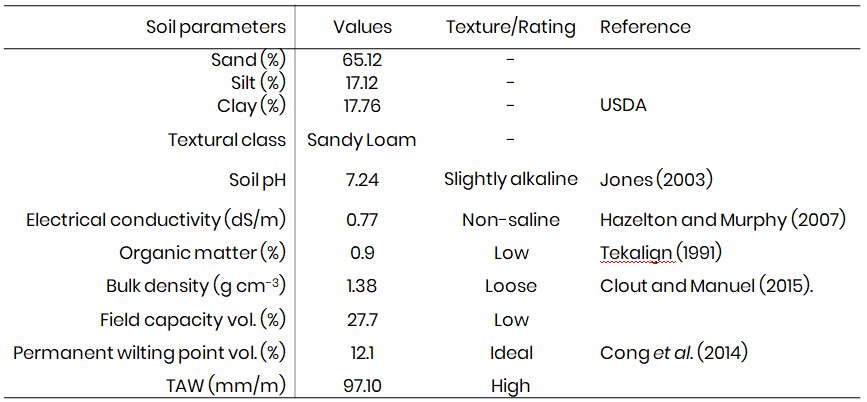
To identify some of the chemical and physical properties of the soil, representative composite soil samples were collected from the experimental site at the depths of 0–20 cm using an auger and core samplers. Some of the physical properties of the soil are given in Table 1. The soil in the experimental field was classified mainly as sandy loam textured. The soil water holding capacity at field capacity (FC) and the permanent wilting point (PWP) were on average 37.7 and 12.1%, respectively. The average soil bulk density (BD) was 1.38 g cm-3 hence, the average total available water (TAW) by volume percentage is also estimated as 97.10 mm/m.
Table 1: Some selected soil physico-chemical analysis of experimental site (0–120 cm)
Irrigation water applied for each treatment
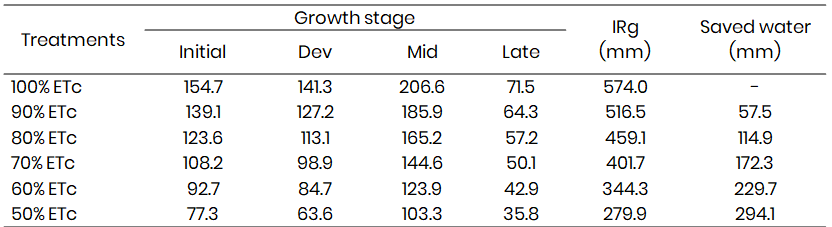
As indicated in Table 2, that reducing irrigation based on actual crop needs (as represented by varying levels of ETc) can lead to substantial water savings while still meeting crop requirements effectively. The analysis shows that reducing irrigation based on varying levels of evapotranspiration (ETc) can lead to substantial water savings ranging from 0 mm at full (100% ETc) to as much as 294.1 mm at reduced levels (50% ETc).
Table 2: Water applied and water saved from each treatment (mm)
Effect of different irrigation levels on yield and yield component of bread wheat
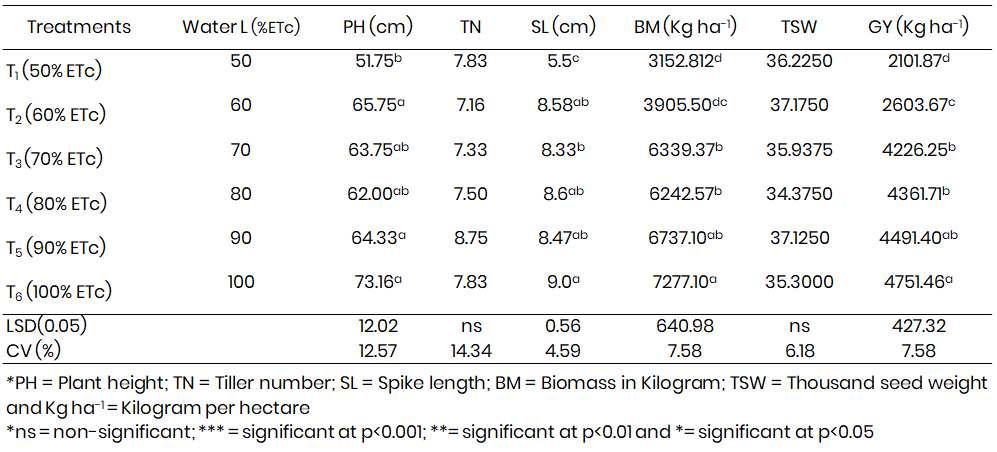
The study of the bread wheat variety “ETW9578” highlights the significant impact that irrigation water levels have on various growth parameters of the plant (Table 3). The findings indicate that under normal conditions, this variety has a total growth period of 94 days from germination to harvest. The research found that irrigation water levels had a highly significant effect (p < 0.001) on plant height. Specifically, treatment T6 resulted in the highest plant height among all treatments. This suggests that adequate irrigation is crucial for maximizing the vertical growth of wheat plants. Similar to plant height, spike length was also significantly affected by irrigation levels. This parameter is essential as it directly relates to the potential yield of the wheat crop. Above ground biomass, which includes all parts of the plant above soil level, was also positively influenced by higher irrigation levels. The results indicated that increased water availability led to greater biomass accumulation, which is critical for overall crop productivity. Grain yields were significantly impacted by irrigation treatments as well, reinforcing the importance of proper water management in achieving optimal yields. Interestingly, while other parameters showed significant differences due to varying irrigation
levels, tiller number and TSW did not exhibit such effects in this study. This could imply that these two factors may be less sensitive to changes in water availability compared to other growth parameters. The findings align with previous research conducted by Mehdizadeh et al., (2013), which reported that water stress negatively affects dry matter accumulation in wheat plants. Furthermore, studies by Mansoor et al., (2023) corroborate these results, indicating that different irrigation levels can influence plant height and above ground biomass by approximately 20% when compared with well- watered treatments. On the other hand, the study shows that the highest grain yield was recorded at 100% ETc, achieving a yield of 4751.46 kg ha-1. This suggests that full irrigation is optimal for maximizing wheat production. Conversely, the lowest yield was observed at 50% ETc, with a yield of only 2101.87 kg ha-1. This stark contrast highlights the detrimental effects of deficit irrigation on wheat productivity. The findings indicate specific percentage increases in grain yield associated with various treatments (T1 to T5) compared to a control treatment (T6). The increases were quantified as follows: T1 (9.33%), T2 (11.55%), T3 (18.75%), T4 (19.35%), and T5 (19.93%). These percentages reflect how incremental increases in irrigation correlate with improved yields.
Notably, treatments T3, T4, and T5 did not show significant differences among themselves, suggesting a plant effect where further increases in irrigation beyond a certain point do not lead to proportional gains in yield. The results align with previous studies conducted by Wang et al., 2019, and Mohammed and Kadhem, 2017, which also reported similar trends regarding the positive impact of adequate irrigation on wheat yields. The highest yield of 4751.46 kg ha-1 was obtained in T6 under full irrigation conditions, while the lowest yield of 2101.87 kg ha-1 occurred in T1 under deficit irrigation regimes (Table 3).
Table 3: Effects of water levels on grain yield and yield components for three cropping seasons
Effect of irrigation water level on water use efficiency
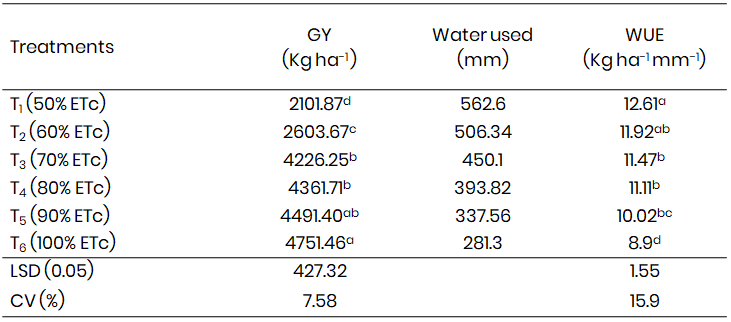
Water use efficiency (WUE) is a critical metric in agricultural practices, particularly in the context of irrigation management. It quantifies the amount of crop yield produced per unit of water used, which is essential for optimizing water resources in agriculture. The findings presented indicate that irrigation levels significantly influence WUE, with statistical significance noted at p < 0.05.
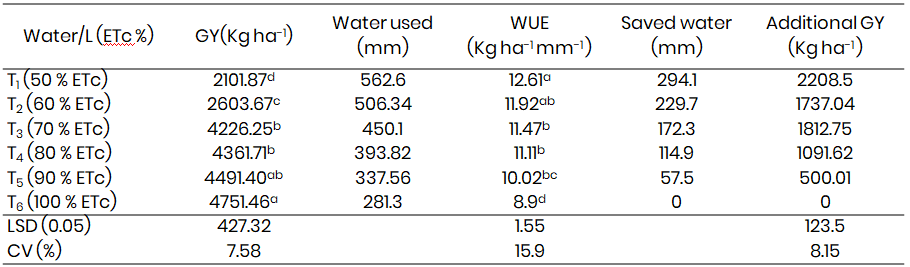
The study highlights that different irrigation treatments were applied, specifically focusing on 50%, 60%, 70%, 80%, 90% ETc and 100% ETc. The results showed that the highest WUE was achieved with the 50% ETc treatment, yielding an impressive 12.61 kg ha-1 mm-1. In contrast, the full irrigation treatment at 100% ETc resulted in a lower WUE of 8.9 kg ha-1 mm-1 (Table 4). The findings align with previous studies conducted on wheat by Pradhan et al., 2014, which similarly demonstrated that reductions in irrigation levels positively impacted WUE for irrigated wheat crops.
Table 4: Effects of water levels on wheat water use efficiency
Deficit irrigation is a strategy where water is applied at levels below full crop water requirements. The goal is to optimize water use while still achieving acceptable yields. In this case, applying 70% ETc allows farmers to conserve water while still maintaining reasonable crop productivity. The statement indicates that by utilizing saved water from these strategies, farmers could increase their water productivity by approximately 42.89%. This significant increase suggests that farmers can achieve more with less water, which is crucial in regions facing water scarcity. The potential yield increase mentioned is up to 1812.75 kg ha-1 when using the optimal irrigation level of 70% ETc. This figure highlights not only the effectiveness of the irrigation strategy but also its economic viability for farmers, as higher yields typically translates into higher profits (Table 5). The study by Kidane et al., 2023 corroborates these findings by reporting a similar level of water use efficiency (1.4 kg m-3) under comparable conditions and agroecology. This consistency across different studies strengthens the validity of the results regarding optimal irrigation practices.
Table 5: Effects water application levels water use efficiency of wheat for each treatments
Conclusion
Different water application levels had significant effect on grain yield, yield related and WUE of bread wheat “ETW9578” variety. Interestingly, while higher irrigation levels improved grain yield, they also resulted in reduced water use efficiency. The highest observed WUE was at the 50% ETc irrigation level, which recorded a value of 12.61 kg ha-1 mm-1. This indicates that at this level of irrigation, the plants were able to produce more grain relative to the amount of water consumed compared to other irrigation levels.
The findings also revealed that reducing irrigation from 100% ETc to 70% ETc did not significantly decrease yield; rather, it allowed for substantial water savings without compromising productivity. Therefore, it can be concluded that a 70% ETc irrigation level strikes an optimal balance between maintaining acceptable yields while conserving water resources.
Based on these findings, it is recommended that farmers within the Qadalle irrigation scheme adopt a 70% ETc irrigation strategy. This approach not only enhances production but also promotes sustainable agricultural practices by conserving valuable water resources.
Acknowledgements
The great pleasure goes to Oromia agricultural research institute for financing the project and all staff of the Irrigation, Drainage and Water Harvesting Engineering research team of Yabello Pastoral Dry land and Agricultural Research Center for their hearty support and peer editorial review, respectively.
Conflicts of interests
Authors declare that there is no conflict of interest exists.
References
Allison, P. D. (2001). Logistic regression using SAS – Chapter 2 [PDF]. SAS Institute. https://www.sas.com
Awulachew, S. B., Yilma, A. D., Loulseged, M., Loiskandl, W., Ayana, M., & Alamirew, T. (2007). Water resources and irrigation development in Ethiopia (pp. 1–123). International Water Management Institute.
Ingrao, C., Strippoli, R., Lagioia, G., & Huisingh, D. (2023). Water scarcity in agriculture: An overview of causes, impacts and approaches for reducing the risks. Heliyon, 9(8), e18507. https://doi.org/10.1016/j.heliyon.2023.e18507
Kidane, D., Janssens, P., Dessie, M., Tilahun, S. A., Adgo, E., Nyssen, J., Walraevens, K., Assaye, H., Yenehun, A., Nigate, F., & Cornelis, W. M. (2023). Effect of deficit irrigation and soil fertility management on wheat production and water productivity in the Upper Blue Nile Basin, Ethiopia. Agricultural Water Management, 277, 108077. https://doi.org/10.1016/j.agwat.2022.108077
Mansoor, M., Khalil, S. H., Khan, M. A., Akbar, G., Khan, M. S., Mustafa, R. N., & Din, S. U. (2023). Impact of different irrigation regimes on growth, yield and nodulation of mung bean. Pakistan Journal of Agricultural Research, 36(4), 335–340. https://doi.org/10.17582/Journal.PJAR/2023/36.4.335.340
Mehdizadeh, M., Darbandi, E. I., Naseri-rad, H., & Tobeh, A. (2013). Growth and yield of tomato (Lycopersicon esculentum Mill.) as influenced by different organic fertilizers. [Journal title missing], 4(4), 734–738.
Mohammed, A. K., & Kadhem, F. A. (2017). Effect of water stress on yield and yield components of bread wheat genotypes. Iraqi Journal of Agricultural Sciences, 48(3), 729–739. https://doi.org/10.36103/ijas.v48i3.386
Pradhan, S., Sehgal, V. K., Das, D. K., Jain, A. K., Bandyopadhyay, K. K., Singh, R., & Sharma, P. K. (2014). Effect of weather on seed yield and radiation and water use efficiency of mustard cultivars in a semi-arid environment. Agricultural Water Management, 139, 43–52. https://doi.org/10.1016/j.agwat.2014.03.005
Senbeta, A. F., & Worku, W. (2023). Ethiopia’s wheat production pathways to self-sufficiency through land area expansion, irrigation advance, and yield gap closure. Heliyon, 9(10), e20720. https://doi.org/10.1016/j.heliyon.2023.e20720
Wang, Y., Yin, W., & Zeng, J. (2019). Global convergence of ADMM in nonconvex nonsmooth optimization. Journal of Scientific Computing, 78(1), 29–63. https://doi.org/10.1007/s10915-018-0757-z
Yakubu, A., Ofori, J., Amoatey, C., & Kadyampakeni, D. M. (2019). Agronomic, water productivity and economic analysis of irrigated rice under different nitrogen and water management methods. Agricultural Sciences, 10(1), 92–109. https://doi.org/10.4236/as.2019.101008
Zwart, S. J., & Bastiaanssen, W. G. M. (2004). Review of measured crop water productivity values for irrigated wheat, rice, cotton and maize. Agricultural Water Management, 69, 115–133. https://doi.org/10.1016/j.agwat.2004.04.007
Copyright
Open Access This article is licensed under a Creative Commons Attribution 4.0 International License, which permits use, sharing, adaptation, distribution and reproduction in any medium or format, as long as you give appropriate credit to the original author(s) and the source, provide a link to the Creative Commons license, and indicate if changes were made. The images or other third party material in this article are included in the article’s Creative Commons license, unless indicated otherwise in a credit line to the material. If material is not included in the article’s Creative Commons license and your intended use is not permitted by statutory regulation or exceeds the permitted use, you will need to obtain permission directly from the copyright holder. To view a copy of this license, visit http://creativecommons.org/licenses/by/4.0/.

