Estimation of soil water and the physical conditions of soils under different management practices on acid soils of Akwa Ibom state, Nigeria
Abstract
The study was carried out in Akwa Ibom State University, to estimate soil water and physical conditions of soil under different management practices on acid soils (coastal plain sands). The management practices were three land use types (fallow plot, grassland and cultivated). Soil and undistributed core samples were collected in three locations in each of the three land use types, bulked for physical and chemical analyses. Soil physical properties (total silt, silt, clay, bulk density, saturated hydraulic conductivity, and total porosity), chemical properties (organic matter, available phosphorus, calcium, magnesium, sodium, potassium, exchangeable acidity, effective cation exchange capacity, base saturation) and soil water characteristics were calculated. The data generated were fitted into 5×3 factorial experiment, Randomized Complete Block Design. The data were subjected into descriptive statistics and land uses were evaluated using Pearson Correlation analysis. For physical properties, the result revealed that sand was the dominant particle size fraction for all land management practices followed by clay and then silt. For chemical properties, the results revealed that base saturation recorded highest mean value at Grassland plot (49.86) and lowest at fallow plot (48.82). For soil water characteristics, Gravimetric Moisture Content (GMC) had highest mean value at cultivated plot (147.59) and lowest at fallow plot (86.19) respectively. The result of management practices shows that there were some relationships between some soil properties and soil water characteristics. Field water capacity correlated positively with permanent wilting point (1.000), correlation result also revealed that total sand correlated negatively with silt (-0.955) and organic matter (-0.777). The knowledge of management of soil water will guide on the proper management practice of soil water for effective productivity.
Introduction
Non availability of soil water is a major obstacle in agricultural production, especially during dry spell and dry season in the area. Since soil is the main source of water taken by the roots of the plants, therefore the management of water in dry spell and dry season in the area is very crucial (Asgarzadeh, 2010). Kirkham (2005) viewed that scarcity or lack of moisture in the soil is not due to lack of the seasonal rainfall and the rain is not distributed well, it is also as the result of mis-management of irrigation processes. Poor soil structure leads to significant water losses in agricultural fields as well as limited water absorption capacity and field crop absorption capacity. Water is essential for plant growth and crop production. Kumar (2010) pointed out that water serves as the solvent and carrier of food nutrients, secured good tilt at right stage of moisture content, helps to achieve good structural formation, improve metabolic activities of micro-organisms, essential for the process of photosynthesis, water maintains the turgidity of plants, it also protects plants from adverse conditions like; drought, frost etc. often an excess deficit of water in the soil is a major problem in crop production and soil formation.
It is limiting factor in seed germination and plant growth. Physical soil quality is a recently widespread term known and is the ability of a particular type of soil to operate within the boundaries of the natural ecosystem to maintain plant productivity, maintain water and air quality and support human health (Essien et al., 2025; Essien et al., 2024). Mismanagement and improper land management practice as a result of the expansion of agricultural land at the expense of forest and pasture land can cause physical degradation of soils, such as lowering soil porousness and rising their bulk density values (Landon, 1998; Sam et al., 2025; Essien et al., 2024; Mark et al., 2024), which leads to deterioration in the physical quality of the soil to a lousy level (Cherub et al., 2016; Simeon and Essien, 2023; Essien et al., 2023). Several factors influence availability of soil water such as porosity, soil texture and structure, organic matter content compaction and biological activities. These greatly influence water infiltration, permeability and water holding capacity. Climate, soil depth, soil characteristics (texture, hydraulic conductivity and salinization level). Topographic characteristics (example; slope and crop properties), (Gwak and Kim, 2016; Essien and Ogban, 2018).
Numerous studies have investigated the availability of soil water and the physical conditions, for example, Smith and Doe, (2018); Zhang et al., (2020); Lal (2000). The study of Ibanga et al. (2023) ; Akpan et al. (2024) ; Akata et al. (2024a) ; Akata et al. (2024b) ; Ben et al. (2024) demonstrated that higher organic matter content led to improved soil porosity and increased water holding capacity. There is no clear information or little understanding about available soil water and the physical conditions of soil under different management practices in acid soils of Akwa Ibom State that can help in, making better soil management decisions. Therefore the study aim at investigating available soil water and the physical conditions on slope under different management practices.
Material and Methods
Site description
The research was conducted on acid soils of Akwa Ibom state, South Nigeria. Akwa Ibom lies between Latitude 4°30' N and 5° 30' N and Longitude 7° 30' E and 8° 20' E. The location of the study area was indicated by the use of GPS. The climate of Akwa Ibom State is characterized by two seasons, namely, the wet or rainy season and dry season. The dry season starts in November and continues up to the first quarter of the following year. The wind become dry and dusty resulting in the Harmattan haze due to the influence of tropical continental air mass and the North East wind. Rainfall in the state is dependent on the location of inter Tropical Zone of Convergent. It last for about 10-11 months near the coast and about 9-10 months northwest. Annual rainfall varies from more than 3000mm along the coast to 2500 mm in the mid-section and about 2,250 mm in the northern fringe (Petters et al., 1989).
The geographical material from which soils of the study areas was developed is coastal plain sands. Akwa Ibom State lies entirely on the coastal plain of Southeastern Nigeria where sediments are supplied by the Cross River, Qua Ibo River and Gulf of Guinea. Generally, the landscape of the state comprises a low-lying plain and riverine area. No position of the landscape exceeds 175m above the sea level. The physiographic of the state is subdivided into six contrasting land forms, namely; mangrove swamps and floodplains with recent alluvial sediments, beach ridge sands, level to undulating sandy plains which occupies a greater portion off the surface area of Akwa Ibom state, sandstone hills, beach ridges with steep-sided valleys and obot mme steep-side isolated hill or upland areas. Akwa Ibom State falls within the broad vegetation community of lowland rainforest and mangrove forest. This vegetation as a result of devastation by man and has degraded into mosaic-farmland, riparian forest and oil forest.
The dominant species for the oil palm forest, riparian forest, mosaic-farmland, the coastal swamp and mangrove include; oil palm (Elaeis guineensis), raffia palm (Raphia hookeri), mango (Mangifera) Avocado (Persea americana), Kola (Kola nitida). Cultivated crops in the area include maize (Zea mays), Yam (Dioscorea spp.), cassava (Manihot esculenta), fluted pumpkin (Telfairia occidentalis), pumpkin (Cucrbita spp.) amongst others. The major food crops grown are: cassava (Manihot esculentum), Yam (Discorea spp), cocoyam (Colosia spp.) and maize (Zea mays). The state could be divided into two ago-ecological zones namely the riverine south and the upland north. Palm is the major economic tree actively cultivated in Akwa Ibom State, either as plantation or in much smaller units. The common fallow length is 3-5 years.
Akwa Ibom State is drained by two major rivers Qua Ibo and Cross River. The major rivers divided the state between two system trends, northwest in southeast demarcating two sub-equal drainage basins to the east and west. (Petters et al., 1989).
Field methods
Soil samples were collected in three (3) land use management practices (fallow plot, grassland and cultivated) in three (3) locations (Oruk Anam, Etinan and Essien Udim Local Government Area), also three random soil samples were collected in three location. A total number of twenty seven (27) samples were collected and another set of undisturbed core samples were collected for the determination of bulk density and hydraulic conductivity.
Laboratory analysis
The bulk samples were air-dried and passed through a 2mm sieve for the following analysis:
Physical Properties
Particles size Analysis: The particles size distribution was determined by the hydrometer method according to the procedure cited in Grossman and Renish (2002). Bulk density was determined using core sampler as described by (Grossman and Renish, 2002). Soil samples were oven dried at 105° C to a constant weight and bulk density calculated using the equation below;
ℓb =
Where;
ℓb= bulk density (Mgm-3)
Ms = mass of oven dry soil (mg)
Vt = Total volume of soil (m-3)
The total volume of soil was calculated from internal dimension of the cylinder.
Total porosity: Total porosity was calculated from particle size and bulk density relationship as described by Grossman and Renish (2002);

Where;
f = Total porosity (m3m-3)
ℓb = bulk density (Mg m-3)
ℓs = particle density (Mg m-3)
Saturated hydraulic conductivity: Saturated hydraulic conductivity (Ksat) was determined using the constant head parameter method (Dane and Topp, 2002). The core sample was placed in a basin of water and allowed to be saturated by capillary. The saturated core sample was then placed in a funnel and a cylinder head was held to core cylinder with a masking tape. The water passing through the soil column was collected into a measuring cylinder and the saturated hydraulic conductivity was calculated using the equation.
Ksat = 
Where;
Ksat = saturated hydraulic conductivity (cmhr-1)
Q = Discharge rate (cm3 min-1)
L = Length of soil column (cm)
 = change in hydraulic head (cm)
A = Cross sectional area through which the flow takes place (cm2)
t = time (minutes)
Field water content (FWC): Field water content was determined using the approximate method described by Dane and Topp (2002). The determination was done with the core cylinders based on the fact that “the content of water, on a mass or volume basis” remaining in a soil two (2) or three (3) days after having been wet and after free drainage is negligible (Six et al., 2000). Field water Content (FWC) was calculated using the equation;
FWC =
Where;
FWC = field water content
M(s+c)i = initial mass of saturated soil + core
M(s+c)f = final mass of oven dried soil + core
Available Water Content (AWC): Available soil water was determined using the approximate method described by Dane and Topp (2002). The determination was done using the core cylinder. Available soil water was calculated using the equation;
AWC = M(s+c)f ÷ M’s
Where;
AWC = Available Water Capacity
M(s+c)i = initial mass of saturated soil + core
M(s+c)f = final mass of oven dried soil + core
Chemical properties
Soil pH was determined using a glass electrode pH metal and in KCl to 1:2.5 soil water ratio (Udo et al., 2009). Organic carbon was measured by Walkly and Black wet digestion method (Udo et al., 2009). Organic matter was calculated by multiplying organic carbon by Van Bemmelen factor of 1.724. Total Nitrogen was determined by micro-kjeldhal digestion method and distillation method described by (Udo et al., 2009). Exchangeable cations was determined by the method described by (Grossman and Renish, 2002). The amount of potassium (K) and sodium (Na) were determined using flame photometer with appropriate filters while magnesium (Mg) and calcium (Ca) was determined by atomic adsorption spectrometer (AAS).
Basic saturation was determined as a sum of exchangeable basic cations divided by ECEC and multiplied by 100% (Udo et al., 2009). Available phosphorus was determined by Bray P-1 extracted and P in the extract was determined using Murphy and Riley Methods as described by (Udo et al., 2009). Exchangeable acidity was determined by titration using KCL extraction method (Peech et al., 1962). Effective cation exchange capacity was obtained by summation of the exchangeable bases and exchangeable acidity (Udo et al., 2009). Electrical conductivity was determined in a 1:2.5 soil/water ratio conductivity bridge (Udo et al., 2009).
Results and Discussion
Effect of Management Practices on Soil Properties
Physical properties
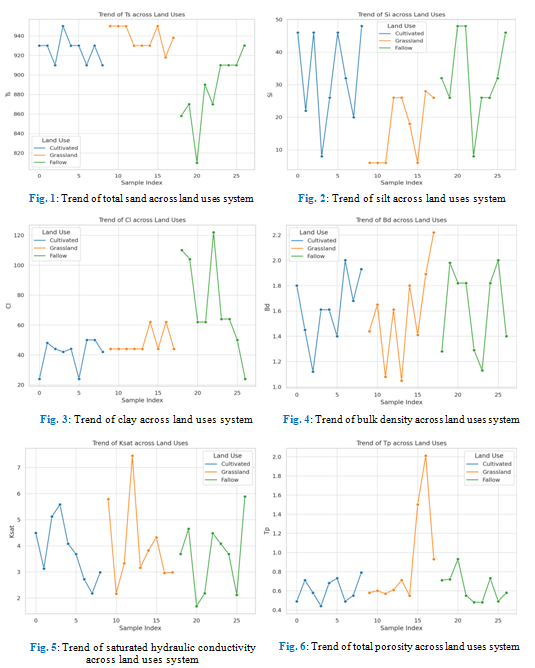
The Figure 1 – 6 shows the trend of soil physical properties affected by management practices in the study area. The result of total sand (Fig. 1) indicated that cultivated plot recorded mean value of 926 ± 13.33 g kg-1 (CV = 1.44%), grass land had a mean value of 938 ± 12.40 g kg-1 (CV = 1.32 %), fallow land recorded a mean value of 884 ± 36.61 g kg-1 (CV = 16.61%).
The result of silt content (Fig. 2) shown that cultivated land recorded mean value of 33 ± 15 g kg-1 (CV = 46%), grass land had a mean value of 17 ± 10 g kg-1 (CV = 62.53%), while fallow had mean value of 32 ± 13.18 g kg-1 (CV = 40.63%).
The result of clay content shown in Fig. 3, indicated that cultivated land recorded mean value of 41 ± 10 g kg-1 (CV = 25%), grass land had a mean value of 48 ± 7.94 g kg-1 (CV = 16.54%), fallow land recorded mean value of 74 ± 31.75 g kg-1 (CV = 43.16%). The primary soil particles were irregularly distributed. This was also found by Essien et al (2023). However, particle size was dominated by sand fraction for all land management practices (The result of bulk density is shown in Fig. 4. The result indicated that bulk density in cultivated land had a mean value of 1.63 ± 0.28 Mgm-3 (CV = 17.18 %), grass land recorded mean value of 1.57 ± 0.03 Mgm-3 (CV = 1.91 %), while fallow land had a mean value of 1.62 ± 0.34 Mgm-3 (CV = 20.99 %).
Ksat was high in grassland follow in cultivated land and follow by fallow plot (Fig. 5), this may be due to high sand content in cultivated plot and grassland, which characterized by larger pore space, also the low Ksat may be probably because of the high water table at the fallow plot.
Chemical properties
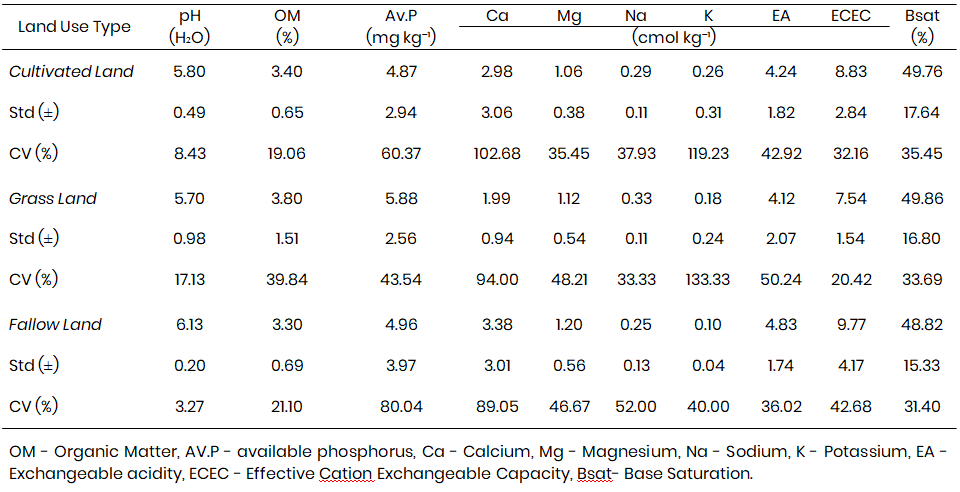
Table 1 present some chemical properties of soils affected by management practices. In cultivated land pH mean value was 5.8 ± 0.49 (CV = 8.43%), Organic matter revealed that the mean value in cultivated land showed 3.4 ± 0.65% (CV = 19.06), AV.P recorded mean value of 4.87 ± 2.94 mg kg-1 (CV = 60.37%), Essien et al. (2025). Ca had mean value of 2.98 ± 3.06 Cmol kg-1 (CV = 102.68%), Mg had mean value of 1.06 ± 0.38 Cmol kg-1 (CV = 35.45 Cmol kg-1), Na recorded mean value of 0.29 ± 0.11 Cmol kg-1 (CV = 37.93%), K had 0.26 ± 0.31 Cmol kg-1 (CV = 119.23%), EA recorded mean value of 4.24 ± 1.82 Cmol kg-1 (CV = 42.92%), ECEC had mean value of 8.83 ± 2.84 Cmol kg-1 (CV = 32.16%) and Bsat recorded mean value of 49.76 ± 17.64% (CV = 35.455%).
At the grassland plot the result revealed that pH recorded mean value of 5.7 ± 0.98 (CV = 17.13%), OM had a mean value of 3.79 ± 1.51% (CV = 39.84%). AV. P had a mean value of 5.88 ± 2.56 mg kg-1 (CV = 43.54%), Ca recorded mean value of 1.99 ± 0.94 Cmol kg-1 (CV = 94.00%), Mg recorded mean value of 1.12 ± 0.54 cmol kg-1 (CV = 48.21%), Na had mean value of 0.33 ± 0.11 Cmol kg-1 (CV = 33.33%), K had a mean value of 0.18 ± 0.24 Cmol kg-1 (CV = 133.33%), EA had a mean value of 4.12 ± 2.07 Cmol kg-1 (CV = 50.24%), ECEC recorded mean value of 7.54 ± 1.54 Cmol kg-1 (CV = 20.42), and Bsat recorded mean value of 49.86 ± 16.805 (CV = 33.69%).
The result of the fallow plot revealed that pH recorded mean value of 6.1 ± 0.20 (CV = 3.27%), OM had mean value of 3.3 ± 0.69% (CV = 21.10%), AV.P had mean value of 4.96 ± 3.97 mg kg -1 (CV = 80.40%), Ca had mean value of 3.38 ± 3.01 Cmol kg-1 (CV = 89.05%), Mg recorded a mean value of 1.20 ± 0.56 Cmol kg-1 (CV = 46.67%), Na had mean value of 0.25 ± 0.13 Cmol kg-1 (CV = 52.00%), K had mean value of 0.10 ± 0.04 Cmol kg-1 (CV = 40.00%), EA had mean value of 4.83 ± 1.74 Cmol kg-1 (CV = 36.02%), ECEC recorded mean value of 9.77 ± 4.17 Cmol kg-1 (CV = 42.68%) and Bsat recorded mean value of 48.82 ± 15.33% (CV = 32.40%).
Table 1: Soil chemical properties affected by management practices in the study area (exchangeable bases)
Relationship between some soil properties and soil water characteristics under cultivated land management practices
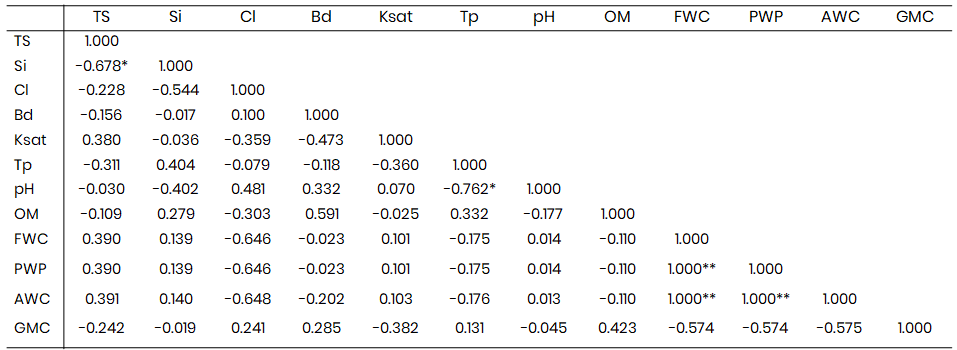
Land uses were evaluated using pearson moment correlation coefficient. Correlation analysis between some soil properties and soil water characteristics under cultivated land use management (Table 2).
Showed that total sand was negatively correlation with silt (-0.0678), the negative relationship between total sand silt may be due to the fact that silt seal up pore space, which affects penetration of fluid down the soil profile. Total porosity correlation negatively pH. Field water capacity correlated positively with permanent wilting point (1.000) and available water capacity (1.000), and permanent wilting point correlated with available water capacity (Fig. 6). The positive relationship between field water capacity permanent wilting point and available water, provide water to resuscitate plant that was about to wilt.
Table 2: Correlation matrix of some soil properties with soil water characteristics under cultivated management practice
Relationship between some soil properties and soil water characteristics under grassland soil management practice.
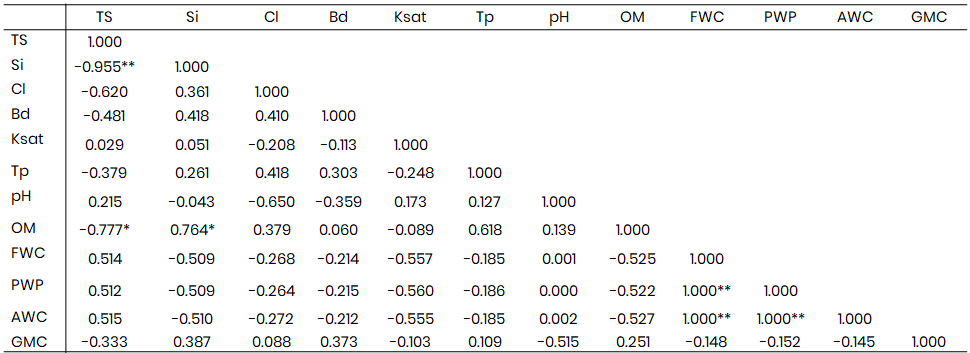
Correlation analysis between some soil properties and soil water characteristics under grassland soil management practice (Table 3) shows that total sand correlated negatively with silt (-0.955) and organic matter (-0.777). Silt correlated positively with organic matter. The positive relationship between Organic matter and Silt, provide binding materials for soil aggregation, may be effective also in bringing about strong inter-particle forces and stability in the tropic soils (Ogban and Essien, 2016). Field water capacity correlated positively with permanent wilting point (1.000) and available water capacity (1.000). Permanent wilting point correlated with available water capacity. The positively relationship may be for provision of water during wilting process in plant.
Table 3: Correlation Matrix of some soil properties with Soil Water Characteristics under Grassland
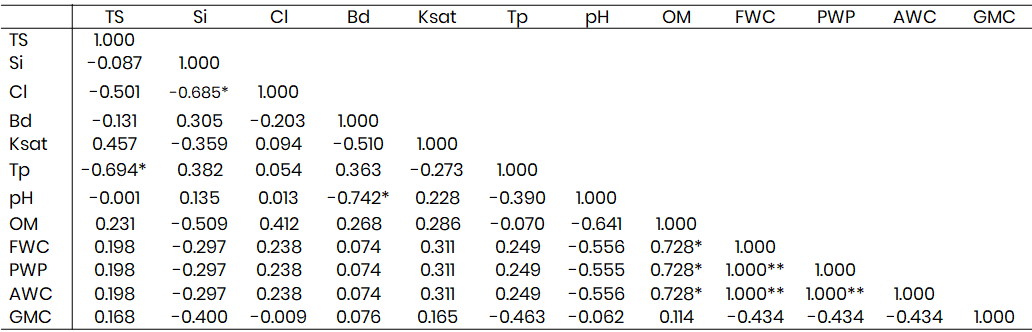
Relationship between some soil properties and soil water characteristics under fallow land management practice
Correlation analysis between some soil properties and soil water characteristics under forest soil management practice (Table 4) revealed that total sand correlated negatively with Total porosity (-0.694), (P 0.01). The negative relationship maybe due to high porosity as characteristics of sand particles that conducts rapid flow of water and has low water retention capacity.
Silt correlated negatively with clay, the negative relationship between silt and clay may be pointed out to the fact that with silt and clay particles the soil pores will be sealed up and hampered percolation of water. Water also may be hold so tight in clay surface and cannot be release for absorption by plant Bulk density correlated negatively with pH (-0.742) (p< 0.01). Organic matter correlated positively with Field water capacity (0.728) (P < 0.01), permanent wilting point (0.728) (P < 0.01) and available water capacity (0.728) (P < 0.01). The positive relationship may be that organic matter plays important role in soil water content, by maintaining a high proportion of macro pores and stabilizes soil structure, which enhances high conductivity of the soil. Field water capacity correlated positively with permanent wilting point (1.000) (P < 0.05) and available water capacity (1.000) (P < 0.5). Permanent wilting point correlated with available water capacity (1.000) (P < 0.5). The positive relationship shows that field water capacity available water capacity and permanent wilting point are inter- related and that with field water capacity, available water capacity can be increase and in turns will be reduction in wilting coefficient.
Table 4: Correlation matrix of some soil properties with soil water characteristics under fallow plot
Conclusion
Estimation of soil water will help to know the water level (condition) and the knowledge will help to guide on the effective management practices that will enhance water in the soil for efficient crop and development of crop. Soil management practices influence the physical conditions of a soil in several ways. It improves soil properties, soil aggregation and texture, soil bulk density, soil porosity and soil hydraulic conductivity, which are indicators of soil health.
References
Akata, O. R., Essien, O. A, Akpan E. A., & Akpan E. G. (2024a). Effect of Inorganic Fertilizer and Lime Rate on Chemical properties of soil and Yield of Cassava (Manihot esculenta Crantz) in Obio Akpan, Akwa Ibom State, Nigeria. Journal of Agriculture, Environmental Resources Management, 6(5), 48 – 60.
Akata, O. R, Essien, O. A., Ben, F. E, Enyong, J. F., & Tochukwu, N. E (2024b) Effect of Different Levels of Poultry Manure on Growth & Yield of a maranthus plant (Amaranthus hybridus) in Obio Akpa, Akwa Ibom State, Nigeria. Asian Journal of Soil Science & plant Nutrition, 10(4), 744 – 751.
Akpan, E. A. Essien, O. A. Akata, O. R., & Opeolv, E. M. (2024). Effect of oil palm Bunch Ash and Harvesting Intervals on Okra (Abelmosclus esculentus L.) Cultivars in Obio Akpa, Akwa Ibom State, Nigeria. Nigeria Journal of Agriculture, Food and Environment 20(1), 21 – 30.
Asgarzadeh, H., & Mossaddeghi. (2010). Soil Water Availability for plants as quantified by conventional available water, least limiting water range and integral water capacity. Plant Soil, 335, 229-244.
Ben, F. E, Essien, O. A., Enyong, J. F., & Essien, I. A. (2024). Effect of poultry manure And super – Gro Fertilizer on the Performance of sweet potato in the lowland Rainforest of Obio Akpa. Nigerian Journal of Horticulture Science Horticultural Society of Nigeria 28(3), 28 – 33.
Copyright
Open Access This article is licensed under a Creative Commons Attribution 4.0 International License, which permits use, sharing, adaptation, distribution and reproduction in any medium or format, as long as you give appropriate credit to the original author(s) and the source, provide a link to the Creative Commons license, and indicate if changes were made. The images or other third party material in this article are included in the article’s Creative Commons license, unless indicated otherwise in a credit line to the material. If material is not included in the article’s Creative Commons license and your intended use is not permitted by statutory regulation or exceeds the permitted use, you will need to obtain permission directly from the copyright holder. To view a copy of this license, visit http://creativecommons.org/licenses/by/4.0/.

