Abstract
Soil erosion is a common phenomenon and major threat in many parts of Ethiopian highlands and it remains difficult to quantify and measure the amount of soil erosion. Geographic Information System (GIS) provides spatial information to identify erosion potential areas and useful tools to estimate the annual soil loss based on Revised Universal Soil Loss Equation (RUSLE). This research was conducted in Central Highlands of Ethiopia, Muziye watershed which is 112 Km far from Addis Ababa north direction and covers 475 ha area. The aim of this research was to estimate the annual soil loss from the watershed and to map the topographic and anthropogenic factors for planning and implementation of sustainable soil conservation and management system in the watershed. A Revised Universal Soil Loss Equation (RUSLE) preferred for Ethiopian conditions and GIS was used to estimate soil losses and identify potential effect of erosion factors. We employed IDW- interpolation map for rainfall erosivity (R) factor, soil map soil erodibility (k) factor, a 30m×30m Digital Elevation Model (DEM) for topography (LS) factor, satellite image for vegetation cover (C) factor, land use and slope class map for management (P) factor. The mean annual soil loss estimated in watershed was 44.67 tons ha-1yr-1 from 569.35 ha. The results revealed that about 23.44 % of the watershed area undergoes moderate (5-10 tones ha-1 yr-1) to very slight (>2 tones ha-1 yr-1) erosion classes, 22.54 % high (10-50 tones ha-1 yr-1) erosion class, 38.8 % from severe (50-100 tones ha-1 yr-1) to very severe (100-500 tones ha-1 yr-1) erosion classes, and 15.23 % catastrophic (>500 tones ha-1 yr-1) erosion class. Based on our findings we recommended that, high to catastrophic erosion risk area of the watershed requires various soil and water conservation activities that intercept runoff by decreasing the transport capacity of flow and improving soil infiltration in the steep slope using terracing, contouring, and strip cropping, reducing the intensity of tillage and growing cover crops and rehabilitating hillside slope areas with different indigenous and exotic tree species should be embarked upon by participating farmers in conservation strategies from plan preparation to implementation. Soil erosion hot spot areas that were identified in the soil erosion map should be given a serious attention and priorities for implementing soil conservation activities before the areas reached to irreversible soil degradations.
Introduction
Soil is a basic resource for economic development and for maintaining sustainable, productive landscapes and people’s livelihoods, especially for countries with agrarian economies like Ethiopia. However, soil degradation is a serious threat in agro-ecosystems and one of the global environmental problems (Abate, 2011). Globally, one-third of agricultural soils are reported to be affected by soil degradation (Hurni, 2002), of which water and wind erosion account for 56% and 28% of the observed damage, respectively (Blanco-Canqui and Lal, 2008). Obviously, soil erosion by water is the most serious form of soil degradation, and this problem is most significant in the tropics and sub-tropics compared to the rest of the world (Lal, 2001).
Soil erosion by water has been a challenging and persistent problem in Ethiopia for decades (Gete, 2000; Bewket and Teferi, 2009; Kebede et al., 2015). The average annual soil loss in Ethiopia is estimated to be 18 tons ha-1year-1 (Hurni, 1985). However, the problem is more severe in the Ethiopian highlands (Gete, 2000; Nyssen et al., 2004; Bewket and Teferi, 2009; Abate, 2011). In the Ethiopian highlands, soil erosion ranges from 16 to 300 tons ha-1year-1 in cultivated lands (Hurni, 1988). In the past, Gete (2000) also reported 130–170 tons ha-1year-1 soil loss on similar land use in the northwestern highlands of Ethiopia.
Every year, an estimated 1.9 to 3.5 billion tons of topsoil in the Ethiopian highlands has been lost, and as a result, about 20,000–30,000 ha of cropland was taken out of production due to severe soil erosion in earlier decades (EFAP, 1993). Tadesse (2001) also indicated that 1.5 million tons of soils have been lost in the Ethiopian highlands each year, which has also resulted in a significant loss of grain from the country’s annual harvest. As a result of soil erosion, poverty and food insecurity are concentrated in rural areas (MoARD, 2010). Thus, in order to achieve food security, poverty reduction, and environmental sustainability in the country, reversing soil erosion is a high priority (Bewket and Teferi, 2009; Abate, 2011).
In order to reverse soil erosion, several efforts have been exerted since the 1970s (Menale et al., 2009; Nigussie et al., 2012). However, past soil conservation efforts did not bring significant changes to the ongoing soil degradation problems (Menale et al., 2009). Erosion prediction involves the use of process-based, empirical, and conceptual models. Most recently, watershed management is an approach followed by the government of Ethiopia to protect soil from erosion in particular, and to reverse land degradation in general (Desta et al., 2005; Gete, 2006; Nigussie et al., 2012). Although dramatic reductions have been made in arresting soil erosion (Nigussie et al., 2012), the approach has not been supported with intervention-prioritizing techniques that identify highly susceptible areas using geospatial analysis. The intervention requires an understanding of the rates of on-site soil erosion processes and the controlling factors that enhance or retard these processes. However, since direct measurements of soil erosion are costly, labor-intensive, and time-consuming, spatial soil erosion models play a vital role in the design of these interventions (Mirco et al., 2003). A Revised Universal Soil Loss Equation (RUSLE), preferred for Ethiopian conditions, and GIS were used to estimate soil losses and identify the potential effect of erosion factors due to its clear and relatively simple computational input requirements compared to other models.
North Shewa Zone is one of the northern parts of the Ethiopian highlands where soil erosion is severe. Hence, identifying and prioritizing erosion-susceptible areas for soil and water conservation measures planning is quite essential. Therefore, the objective of this study is to assess and identify the erosion risk-prone areas across the landscape of the watershed for planning conservation measures in the watershed.
Objectives of the study
- To estimate the spatial distribution of soil erosion of the entire watershed.
- To provide a complete map of soil erosion susceptibility and land use/cover changes.
- To identify and prioritize erosion risk prone areas for intervention.
Material and Methods
Description of the study area
Geographical Location
The study was conducted at the Muziye watershed in Girar Jarso district of the North Shewa Zone, which is approximately located 117 km north of the capital city of Ethiopia (Addis Ababa), and 5 km from Fitche town, the capital of the North Shewa Zone. The watershed is situated between 38°44’30’’E – 38°47’30’’E and 9°47’30’’N – 9°49’30’’N (Fig. 1). The watershed covers a total area of 569.35 ha and drains into the Abay Basin.
Topography and Climate
The landforms of the watershed are characterized by valleys, plateaus, hills, and plains (GJWARDO, 2022), and the altitude ranges from 1,763 m to 3,096 m above sea level. The watershed exhibits two major agroecological conditions: lowland (gammojji) and midland (badda-daree), which account for 71% and 29% of the watershed area, respectively. The area receives an average annual rainfall of 1,013 mm. The mean monthly temperature ranges from 12.2°C to 28°C, with a mean annual temperature of 20.4°C.
Vegetation, Soil, and Land Use
The dominant trees and shrubs found in the watershed include Cordia Africana, Ficus spp., and Eucalyptus. These species provide various economic and social benefits, such as firewood, livestock forage, beekeeping, fencing, soil erosion control, soil fertility maintenance, and shading. The major crops grown in the watershed include sorghum, wheat, barley, and teff. In addition, various vegetable crops are cultivated such as potato, onion, cabbage, and others-with onion being the most dominant among the vegetables.
The farming system is a mixed one, primarily oxen-plowed cereal crop production alongside livestock rearing, a system that has been practiced for centuries. The major land use types in the watershed include cultivated land, grazing land, shrub/bushland, settlements, natural forest, and woodlands. However, the distribution of these land use types is very fragmented.
Due to the exploitative nature of land use practices, the watershed is generally characterized by severe land degradation, evidenced by soil erosion, declining soil fertility, deforestation, low vegetation cover, and declining land productivity. Most parts of the watershed have relatively steep slopes and shallow soils, placing the remaining soil on cultivated and grazing lands at risk. This is primarily due to the total removal of topsoil through accelerated erosion on steep lands.
Population
The total population of the peasant association within the watershed is approximately 14,287-comprising 7,220 males and 7,067 females. These represent a total of 2,926 households (HH), with 2,507 male-headed and 419 female-headed households. The average family size is five persons per household, with males being slightly more in number.
Site selection and mapping of the watershed
The watershed was purposively selected based on the prevalence of resource management and land degradation problems, topographical features, and road accessibility. Based on the preliminary outlet identified during the site selection process, the watershed boundary was delineated using primary data (GPS readings). Finally, a map of the watershed was produced, and other information such as elevation range and slopes was extracted.
Source of data
Both primary and secondary data were used in the study.
Primary data was collected through topographic transect walks and field observation. During these walks, information was gathered on vegetation types, major land use/land cover (LULC) patterns, and soil and water conservation practices (both improved and traditional) implemented on agricultural lands with different slope classes. Additionally, a Global Positioning System (GPS) was used to collect ground-truth data for image classification and soil loss vulnerability verification.
Secondary data included:
- Landsat 6 ETM+ imagery with a spatial resolution of 30 × 30 m, acquired from the Ethiopian Mapping Agency for LULC classification;
- A digital soil map from FAO with a resolution of 30 × 30 m;
- Digital Elevation Model (DEM) at 30 × 30 m resolution;
- Time series climatic data (especially rainfall) from the National Meteorology Agency;
- Farm management data from the Woreda Agriculture and Natural Resource Development Office.
Methods of determining RUSLE factors
GIS techniques were integrated with the Revised Universal Soil Loss Equation (RUSLE), an empirical soil loss model, to estimate the mean annual soil loss of the watershed. The five major factors considered in the RUSLE model are:
- Rainfall pattern (R)
- Soil type (K)
- Topography (LS)
- Crop management (C)
- Conservation practices (P)
RUSLE is widely used to estimate soil loss from watersheds with various land use types (Gelagay and Minale, 2016). It is preferred due to its simplicity and relatively low data input requirements compared to other models. The basic methodological approach followed in the application of RUSLE is illustrated in the simplified flow chart (Fig. 2).
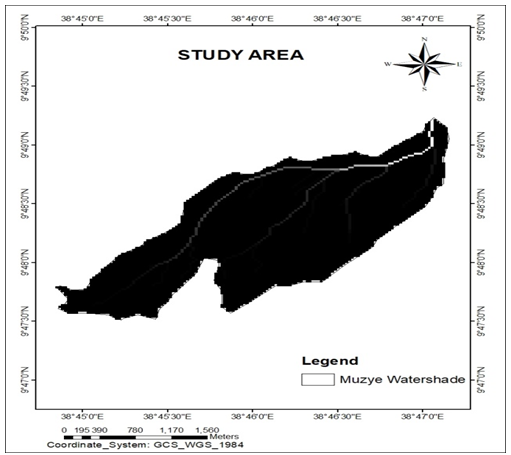
Fig. 1: Map of Muziye watershed
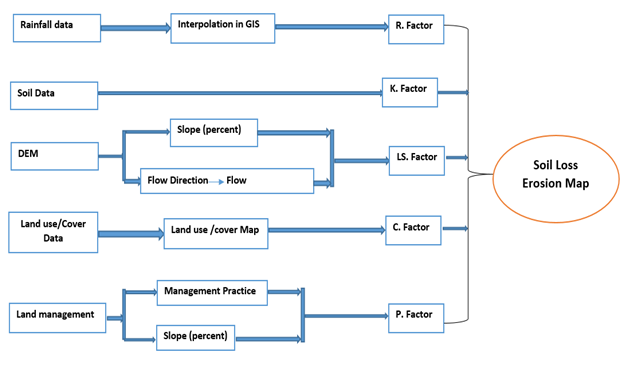
Fig. 2: Conceptual framework of soil loss estimation
Determination of rainfall erosivity (R-factor)
The Rainfall Erosivity Factor (R) represents the erosive force of a specific rainfall event (Alexakis et al., 2013). It is primarily determined by the amount, intensity, and distribution of rainfall (Tadesse and Abebe, 2014). Due to the absence of rainfall intensity data, we adopted the R-correlation established by Hurni (1985) for Ethiopia, which has been used in other similar studies (Bewket and Teferi, 2009; Abate, 2011; Derege et al., 2012; Tadesse and Abebe, 2014; Kebede et al., 2015; Gelagay and Minale, 2016).
We calculated the mean annual rainfall based on monthly rainfall data from nine meteorological stations for the period 1990–2022 and computed the R-factor for each station using the following equation (Hurni, 1985):
R= −8.12 + (0.562 × P)-----------------------------(1)
Where:
- R - Rainfall erosivity factor in MJ·mm·ha⁻¹·yr⁻¹
- P - Mean annual rainfall (mm)
To produce an R-factor map, the interpolated R-values were converted into a raster format with 30 m resolution and extracted for the studied watershed.
Determination of soil erodibility (K-factor)
The Soil Erodibility Factor (K) expresses a soil’s inherent resistance to particle detachment and transport by rainfall. It is influenced by the cohesive forces between soil particles, which may vary based on plant cover, soil moisture content, and the development of soil structure (Wischmeier and Smith, 1978). It also depends on factors such as organic matter content, soil texture, surface horizon structure, and permeability (Robert and Hilborn, 2000).
For this study, a digital soil map from the Ministry of Agriculture (MoA) was used to derive the soil map of the study watershed. The K-factor was estimated based on soil color information referenced from the FAO (2012) soil database, adapted for Ethiopia by Hurni (1985) and Hellden (1987), as shown in Table 1.
Once the dominant soil type map of the study area was clipped in the ArcGIS environment, each soil characteristic - particularly soil color - was obtained from the FAO digital soil map.
|
Table 1: Soil color and K - value based on Hurni (1985), Hellden (1987) |
||||
|
Soil color |
Black |
Brown |
Red |
Yellow |
|
K-factor |
0.15 |
0.2 |
0.25 |
0.3 |
Determination of topographic factor (LS-factor)
The LS-factor in the Revised Universal Soil Loss Equation (RUSLE) is a combination of slope length (L) and slope steepness (S) factors (Alexakis et al., 2013). The steeper and longer the slope, the greater the rate of soil erosion due to the higher accumulation and velocity of surface runoff (Abate, 2011; Alexakis et al., 2013; Tadesse and Abebe, 2014).
In this study, slope length and slope steepness values were derived from a Digital Elevation Model (DEM) with 30m resolution using the ArcGIS Spatial Analyst tool and the Arc Hydro tool. The LS-factor was then calculated and mapped using methods applied in previous studies such as Bewket and Teferi (2009) and Kamaludin et al. (2013).
The following equations were used:
 ---------------------------------(2)
S = 0.065 + 0.045S + 0.0065S2------------------(3)
 2---------(4)
Where:
FA - Flow accumulation
S - Slope in percentage
Cell size is 30 m (DEM resolution)
LS is the topographic factor
Determination of crop and management cover (C-factor)
The C-factor represents the ratio of soil loss from land covered by vegetation to the corresponding loss from bare or continuously fallow land (Morgan, 2005). It reflects the influence of vegetation cover, crop type, and land management practices on soil erosion.
To determine the C-factor for the study area, a land use and land cover (LULC) map was prepared using a Landsat 6 ETM+ satellite image with a spatial resolution of 30 m × 30 m. A supervised digital image classification technique was employed to identify different land cover types. Ground truth data were collected through field verification to improve the accuracy of the classification.
C-values for each LULC category were assigned based on values suggested by various authors, as presented in Table 2.
|
Table 2: Land cover and their C-values suggested by different authors for different LULC |
||
|
Land cover |
C value |
References |
|
Agricultural land |
0.15 |
Hurni (1985); Bewket and Teferi (2009); Tadesse and Abebe (2014) |
|
Forest land |
0.001 |
Hurni (1985); Morgan (2005) |
|
Degraded forest |
0.005 |
Hurni (1985); Morgan (2005) |
|
Shrub land |
0.014 |
Wischmeier and Smith (1978); Abate (2011); Gelagay and Minale (2016) |
|
Grazing land |
0.01 |
Hurni (1985); Morgan (2005); Abate (2011); Tadesse and Abebe (2014) |
|
Bare land |
0.6 |
Hurni (1985); Morgan (2005) |
|
Settlement area |
0.09 |
Ganasri and Ramesh (2015) |
Determination of conservation practice factor (P-factor)
The P-factor represents the effect of specific soil and water conservation practices on reducing the velocity of surface runoff, enhancing water infiltration, and consequently minimizing soil loss and sediment transport (Renard and Foster, 1983).
To determine the P-factor in the RUSLE model, data were collected through field observations and assessment of existing conservation practices within the study area using ArcGIS. A topographic transect walk was conducted to evaluate major land use/land cover types and identify the types of soil and water conservation measures implemented, particularly on agricultural land.
Agricultural lands were categorized into six slope classes. Since no permanent soil and water conservation structures were present to control runoff, P-values for each slope class were assigned based on values from similar studies, including those by Wischmeier and Smith (1978), as shown in Table 3.
Finally, the assigned P-factor values were applied using the Spatial Analyst Tool’s "Reclassify" function in ArcGIS. The resulting data were converted into a grid format with a cell size of 30 m × 30 m.
|
Table 3: P - values suggested by Wischmeier and Smith (1978) for the different slope classes of agricultural land and other land. |
||
|
Land use |
Slope (%) |
P-value |
|
Agricultural land |
0-5 |
0.1 |
|
|
5-10 |
0.12 |
|
|
10-20 |
0.14 |
|
|
20-30 |
0.19 |
|
|
30-50 |
0.25 |
|
|
50-100 |
0.33 |
|
Other land |
All |
1.00 |
Total soil loss analysis (A)
The average annual soil loss rate was calculated using a cell-by-cell analysis of the soil loss surface. This was achieved by multiplying the respective RUSLE factor values - R, K, LS, C, and P - using the Spatial Analyst Tool – Map Algebra function in ArcGIS, as per the equation developed by Hurni (1985). The resulting soil loss map was then converted to a hectare basis to express annual soil loss in tons per hectare per year.
A = R × K × LS × C × P----------------------------(5)
Where:
- A = Computed spatial average soil loss (ton/ha/year)
- R = Rainfall erosivity factor (MJ·mm/(ha·h·yr))
- K = Soil erodibility factor (t·ha·h/(ha·MJ·mm))
- LS = Slope length and steepness factor (dimensionless)
- C = Cover management factor (dimensionless)
- P = Conservation practice factor (dimensionless)
Data analysis
Data processing and analysis were conducted by digitizing, calculating, and classifying the required information for each thematic layer using ArcGIS. Additionally, simple statistical methods - such as percentage and average - were employed to assist in the analysis and interpretation of the results.
Results and Discussion
Estimation of soil erosion factor values
Rainfall erosivity factor (R)
The distribution of average annual rainfall over the 32-year period in the study area varies across different locations within the watershed. The results indicate that annual rainfall in the watershed ranged from 1213.78 mm to 1293.18 mm. correspondingly, the R-values (rainfall erosivity factor) in the study area ranged from 674.02 to 718.65 MJ·mm·ha-1 yr-1, as illustrated in Fig. 3. The average R-factor value for the watershed was 695.76 MJ·mm·ha-1 yr-1. This value falls within the range of 441.5 to 1166.4 MJ·mm·ha-1 yr-1, as estimated by Amsalu and Mengaw (2014) for Jabi Tehinan Woreda, Amhara National Regional State (ANRS), Ethiopia.
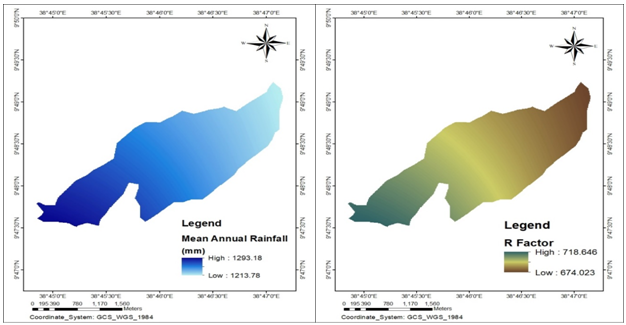
Fig. 3: Mean annual RF and R-factor map of the watershed
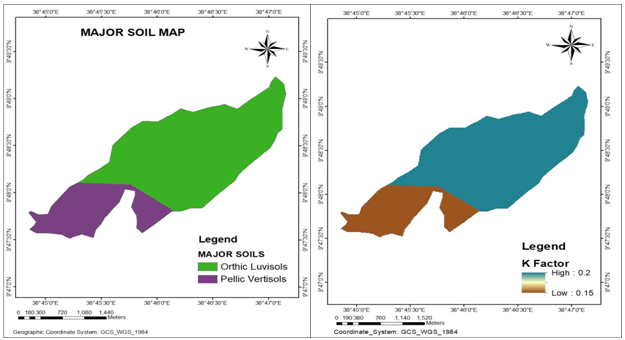
Soil Erodibility Factor (K-Values)
Two major soil types were identified within the study watershed: Orthic Luvisols and Pellic Vertisols. The corresponding soil erodibility (K) values and their proportions relative to the total watershed area are as follows: Orthic Luvisols – 0.20 (70.77%), and Pellic Vertisols – 0.15 (29.23%) (Table 4). The soils in the study area exhibit two distinct K-values, ranging from 0.15 to 0.20. A higher K-value indicates greater susceptibility to erosion, whereas a lower value suggests more resistance.
Table 4: Soil types, coverage and K value based on Hurni (1985), Hellden (1987)
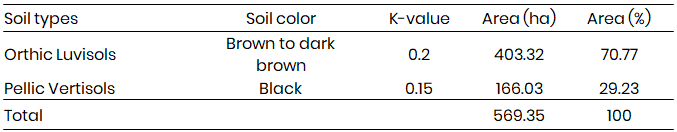
The watershed is predominantly covered by Orthic Luvisols, which are characterized by a brown to dark brown color. According to Mati et al. (2000), soils with a brown hue and high sand content tend to have weak structural stability, making them more prone to disintegration. As a result, these soils are more easily detached and transported by surface runoff (Fig. 4).
Fig. 4: Soil types and K-factor map of the watershed
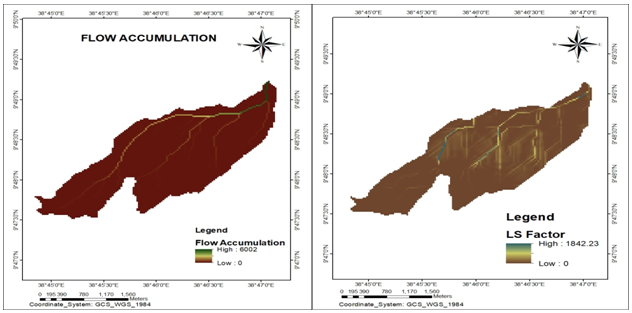
Slope Length and Slope Steepness Factor (LS-Values)
The interaction between slope length and slope steepness significantly influences the magnitude of soil erosion. Due to this relationship, both factors should always be considered together when assessing erosion potential (Alexakis et al., 2013). The results of this study indicate that LS-factor values in the watershed range from 0 in flat areas to as high as 1842.23 in regions with steeper and longer slopes. This increasing LS value demonstrates that potential erosion intensifies with increasing slope steepness.
The topography of the watershed clearly contributes to higher rates of soil loss. Approximately 68.95% of the study area consists of steep and long slopes, which lead to higher surface runoff velocities and, consequently, greater erosion potential. Longer and steeper slopes - especially those lacking sufficient vegetative cover - are particularly vulnerable to severe erosion during heavy rainfall events (Blanco-Canqui and Lal, 2008). These findings emphasize that topographic factors, as represented by the LS-factor, play a dominant role in the erosion process (Adediji et al., 2010) (Fig. 5).
Fig. 5: Flow accumulation and LS-factor map of the watershed
Crop management factor (C-Values)
Based on the land use/land cover (LULC) analysis, the study watershed was classified into seven categories: agricultural land, forest land, degraded forest land, shrubland, grazing land, bare land, and settlement areas. Agricultural land is the predominant land use type, covering 50.65% (288.33 ha) of the total watershed area, while the remaining 49.35% (311.02 ha) is occupied by other land use types, as shown in Table 5.
Table 5: Land use land cover area coverage and their C values suggested by different authors for different land use land cover.
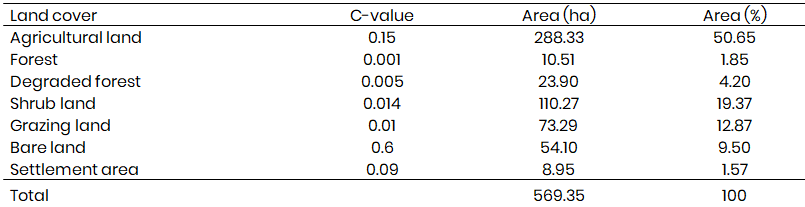
The C-factor values within the watershed range from 0.001 in areas covered by dense forest to 0.6 in bare land. This variation in C-values reflects the differences in vegetative cover and land management practices. Bare land exhibits the highest C-value, indicating the greatest potential for soil erosion. These findings suggest that areas with minimal or no vegetation, such as bare land, are more susceptible to runoff and soil loss (Vander et al., 2000). This is illustrated in Fig. 6, which highlights the spatial distribution of C-values across the watershed.
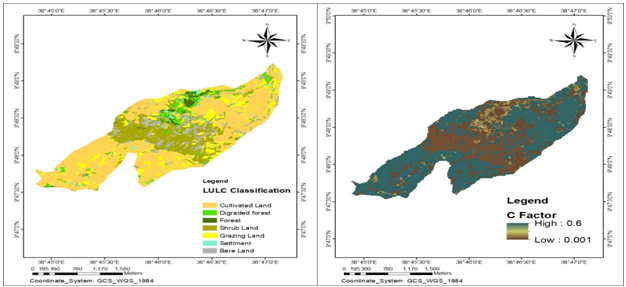
Fig. 6: Land use land cover and C-factor map of the watershed
Conservation practice factor (P)
In the study watershed, there is only a small part of watershed area was treated by terracing; periodic maintenance of structure by land users was ignored. Such condition coupled with poor vegetation cover in watershed area has large influence on soil loss rate. The result the study shows that, the minimum p-value is 0.1 for the cultivated land with a slope of less than 5% and the maximum P-value is 1 which is the value assigned for other land use types excluding agricultural land (Fig. 7). Renard et al. (1997) defined conservation practice factor as an expression of supporting conservation practices such as contour farming, strip cropping, terracing, and subsurface drainage on soil loss at a particular site, which principally affect water erosion by modifying the flow pattern, grade, or direction of surface runoff and by reducing the volume and rate of runoff.
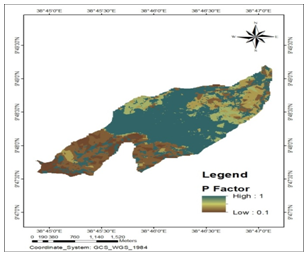
Fig. 7: P-factor map of the watershed
Total soil loss analysis (A)
The annual soil loss rate of the study watershed was determined by a cell-by-cell analysis of each RUSLE factor. The annual soil loss rate of the study watershed ranges from less than 2 tons ha-1 yr-1 in the flat areas to over 500 tons ha-1 yr-1 in the very steep slopes of the watershed. The mean annual soil loss rate estimated by the RUSLE model for the study watershed was 44.67 tons ha-1 yr-1 from 569.35 ha. The estimated annual average soil loss rate for the study watershed is high compared to previous studies. For example, Tadesse and Abebe (2014) reported 30.4 tons ha-1 yr-1 soil loss for Jabi Tehinan Woreda in the northwestern highlands, while Gerawork (2014) estimated soil loss from Loma Woreda as 10.28 tons ha-1 yr-1. Similarly, Gebreyesus and Kirubel (2009) estimated soil loss due to erosion in the Medego watershed as 9.63 tons ha-1 yr-1. Hurni et al. (2008) estimated that soil loss due to erosion in cultivated fields in Ethiopia amounts to about 42 tons ha-1 yr-1, and FAO (1986) reported the annual average soil loss rate for the Central and Northern Highlands as 35 tons ha-1 yr-1. Therefore, the relatively high estimated average annual soil loss in the current study watershed could be due to the topography, which is largely sloping (8-15%) to very steep (>50%), accounting for 65.24% of the watershed area. Another contributing factor is that only a small part of the watershed area has been treated with terracing, and there is a lack of periodic maintenance of constructed conservation structures by land users.
Classification and prioritization of critical erosion-prone areas for conservation planning
One of the objectives of this study was to classify and prioritize critical erosion-prone areas for conservation planning. Accordingly, the delineation of the watershed into erosion-prone areas was based on the severity level of soil loss, giving priority to targeted and cost-effective conservation planning (Kaltenrieder, 2007). According to Morgan (2009), the total annual soil loss potential of the study watershed was classified into seven soil erosion severity classes: less than 2 tons ha-1yr-1 as very slight, 2–5 tons ha-1 yr-1 as slight, 5–10 tons ha-1 yr-1 as moderate, 10-50 tons ha-1 yr-1 as high, 50–100 tons ha-1 yr-1 as severe, 100–500 tons ha-1 yr-1 as very severe, and more than 500 tons ha-1 yr-1 as catastrophic, as shown in Table 6.
The final risk classes were prioritized for intervention based on the maximum allowable soil loss that sustains economic and high productivity levels (Wischmeier and Smith, 1978). Based on the results, the mean annual soil loss rate for the entire watershed (44.67 tons ha-1 yr-1) is above the tolerable soil loss threshold of 5–11 tons ha-1 yr-1 estimated for Ethiopia by Hurni (1985). The results of the study show that about 23.44% of the watershed area undergoes erosion ranging from moderate to very slight classes, 22.54% falls under the high erosion class, 38.8% experiences severe to very severe erosion, and 15.23% is classified under the catastrophic erosion class, according to Morgan’s classification (2009), as shown in Table 6. In the study area, slope classes with the largest soil loss rates are primarily due to high erosivity (R-factor) from intense rainfall, high soil erodibility (K-factor), high LS-values - especially due to slope steepness - and the absence of support practices (P = 1). Field observations further indicated that the steeper parts of the land lack vegetative cover and are subject to intensive tillage operations, inadequate soil and water conservation measures, and a general disregard by land users for maintaining conservation structures. This includes failure to remove sediment from channels and repair embankments, which has significantly contributed to the high soil loss potential in the area (Fig. 8).
Table 6: Annual soil loss rates and severity classes with their conservation priority in the watershed (Morgan, 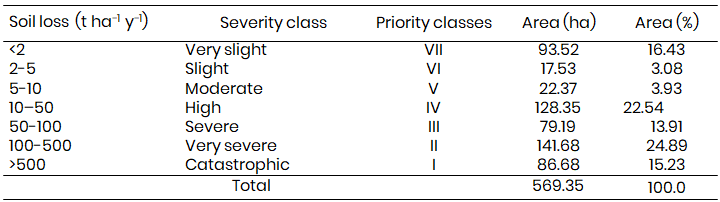
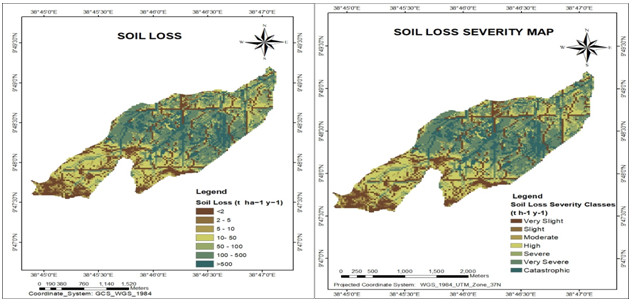
Fig. 8: Annual soil loss and severity classes of the watershed
Conclusion
The mean annual soil loss estimated in the Muziye watershed was 44.67 tons ha-1 yr-1 across a total area of 569.35 hectares. The results indicate that approximately 23.44% of the watershed falls under the moderate (5–10 tons ha-1 yr-1) to very slight (<2 tons ha-1 yr-1) erosion classes, 22.54% under the high (10–50 tons ha-1 yr-1) erosion class, 38.8% under the severe (50–100 tons ha-1 yr-1) to very severe (100–500 tons ha-1 yr-1) erosion classes, and 15.23% under the catastrophic (>500 tons ha-1 yr-1) erosion class, according to Morgan's classification (Morgan, 2009).
The high soil loss observed in the watershed is primarily aggravated by topographic factors, particularly slope steepness, as well as high rainfall erosivity (R-factor), elevated soil erodibility (K-factor), and the lack of effective conservation practices (P-factor). These factors collectively contribute to severe changes in the watershed’s hydrological and biological functions, ultimately affecting the ecosystem services that soil provides to human communities. This degradation can significantly impact annual crop yields and overall land productivity, threatening local food security. In addition, the severity of erosion may cause off-site effects such as sedimentation in nearby water bodies.
To reduce soil loss in the study area, several watershed rehabilitation measures are recommended. High to catastrophic erosion-risk zones require the implementation of soil and water conservation practices designed to intercept runoff, reduce the transport capacity of surface flow, and improve soil infiltration. These include techniques such as terracing, contour farming, strip cropping, reduced tillage intensity, and the use of cover crops. Rehabilitation of hillside areas with indigenous and exotic tree species should also be encouraged, with active participation from farmers in planning and implementation. Special attention should be given to soil erosion hotspot areas identified on the erosion severity map, prioritizing them for immediate intervention to prevent irreversible land degradation.
Acknowledgements
The authors would gratefully need to acknowledge Oromia Agricultural Research Institute, Fitche Agricultural Research Center for financial funds of this research activity. Moreover, all staff members of Fitche Agricultural Research Center who directly or indirectly helped in data collection and other research activities are highly acknowledged.
Conflicts of interests
Authors declare that there is no conflict of interest exists.
References
Abate, S. (2011). Estimating soil loss rates for soil conservation planning in the Borena Woreda of South Wollo Highlands, Ethiopia. Journal of Sustainable Development in Africa, 13(3), 87–106. https://www.ajol.info/index.php/jsda/article/view/111844
Adediji, A., Tukur, A. M., & Adepoju, K. A. (2010). Assessment of Revised Universal Soil Loss Equation (RUSLE) in Katsina area, Katsina State of Nigeria using remote sensing (RS) and Geographic Information System (GIS). Iranica Journal of Energy and Environment, 1(3), 255–264. https://www.ijee.net/article_1022.html
Alexakis, D., Hadjimitsis, D., & Agapiou, A. (2013). Integrated use of remote sensing, GIS and precipitation data for the assessment of soil erosion rate in the catchment area of “Yialias” in Cyprus. Atmospheric Research, 131, 108–124. https://doi.org/10.1016/j.atmosres.2013.05.007
Amsalu, T., & Mengaw, A. (2014). GIS based soil loss estimation using RUSLE model: The case of Jabi Tehinan Woreda, ANRS, Ethiopia. Natural Resources, 5, 616–626. https://doi.org/10.4236/nr.2014.514055
Bewket, W., & Teferi, E. (2009). Assessment of soil erosion hazard and prioritization for treatment at the watershed level: Case study in the Chemoga watershed, Blue Nile basin, Ethiopia. Land Degradation and Development, 20, 609–622. https://doi.org/10.1002/ldr.899
Copyright
Open Access This article is licensed under a Creative Commons Attribution 4.0 International License, which permits use, sharing, adaptation, distribution and reproduction in any medium or format, as long as you give appropriate credit to the original author(s) and the source, provide a link to the Creative Commons license, and indicate if changes were made. The images or other third party material in this article are included in the article’s Creative Commons license, unless indicated otherwise in a credit line to the material. If material is not included in the article’s Creative Commons license and your intended use is not permitted by statutory regulation or exceeds the permitted use, you will need to obtain permission directly from the copyright holder. To view a copy of this license, visit http://creativecommons.org/licenses/by/4.0/

