Abstract
Nitrate availability plays a crucial role in shaping cyanobacterial physiology, community structure, and bloom dynamics in freshwater ecosystems. Understanding its influence under controlled conditions provides valuable insight into nutrient thresholds governing bloom formation. In this study, we investigated the effects of four nitrate concentrations (0.5, 1, 5, and 10 mg L-1 NO₃⁻-N) on the growth kinetics and chlorophyll-a accumulation of a Microcystis like cyanobacterium isolated from a freshwater pond. Cultures were maintained in modified BG-11 medium under standardized temperature, light, and aeration for eight days. Biomass growth was monitored by measuring optical density at 680 nm (OD₆₈₀) every two days, while chlorophyll-a content was quantified spectrophotometrically at the end of the experiment. Growth and pigment synthesis increased with nitrate concentration up to 5 mg L-1, beyond which further enrichment resulted in a decline. The 5 mg L-1 treatment exhibited the highest OD₆₈₀ (0.60 ± 0.01) and chlorophyll-a concentration (5.8 ± 0.3 µg mL-1). Both nitrate limitation (0.5-1 mg L-1) and excess (10 mg L-1) suppressed growth, indicating an optimal intermediate nitrate level for Microcystis proliferation. These findings highlight the critical balance between nutrient supply and cyanobacterial productivity, providing insights into nutrient management strategies aimed at mitigating harmful algal blooms in freshwater environments.
Introduction
Cyanobacteria, also known as blue-green algae, are among the oldest and most ecologically important microorganisms on Earth. They play a dual role in aquatic ecosystems - functioning as primary producers that sustain food webs, while also being major contributors to harmful algal blooms (HABs) in nutrient-enriched waters. In freshwater environments, cyanobacteria contribute significantly to global carbon and nitrogen cycling, oxygenic photosynthesis, and ecosystem stability (Paerl & Otten, 2013). However, under favorable nutrient and climatic conditions, they can proliferate rapidly and form dense blooms that threaten water quality, aquatic biodiversity, and human health.
Eutrophication, primarily caused by anthropogenic nutrient inputs, has intensified the frequency and severity of HABs worldwide (Paerl et al., 2016). Nutrient enrichment from agricultural runoff, sewage discharge, and industrial effluents increases the availability of nitrogen (N) and phosphorus (P), the two major macronutrients that limit primary productivity in freshwater systems. While phosphorus has traditionally been considered the main driver of eutrophication, recent studies emphasize that nitrogen also plays a critical role in sustaining and regulating cyanobacterial growth (Glibert et al., 2016; Gobler et al., 2016).
Nitrogen exists in various forms in aquatic ecosystems, including nitrate (NO₃⁻), nitrite (NO₂⁻), ammonium (NH₄⁺), and dissolved organic nitrogen. Among these, nitrate is often the most stable and prevalent oxidized form. Cyanobacteria can assimilate nitrate as a nitrogen source through the action of nitrate reductase and nitrite reductase enzymes, which convert it into ammonium for incorporation into amino acids and proteins (Flores & Herrero, 2005). However, the efficiency of nitrate assimilation depends on its concentration, the availability of other nutrients, and environmental factors such as light, temperature, and pH.
The response of cyanobacteria to nitrate availability is complex and species-specific. At low nitrate concentrations, cyanobacteria experience nitrogen limitation, resulting in reduced growth, pigment synthesis, and photosynthetic efficiency. Conversely, excessive nitrate can disrupt cellular homeostasis, alter the C:N ratio, and even suppress nitrogen-fixation pathways in diazotrophic species (Harke & Gobler, 2013). This biphasic response suggests the existence of an optimal nitrate range that supports maximum growth without inducing metabolic stress. Understanding this threshold is vital for predicting bloom dynamics and designing nutrient management strategies.
Among bloom-forming cyanobacteria, Microcystis species are the most widespread and notorious. They dominate eutrophic freshwater bodies worldwide and are frequently associated with toxin production, particularly microcystins - hepatotoxins that pose serious risks to aquatic life and humans (Codd et al., 2005). Microcystis forms dense surface scums under calm, nutrient-rich conditions and can outcompete other phytoplankton through buoyancy regulation, high light tolerance, and efficient nutrient uptake mechanisms (Xie et al., 2003). Nitrogen availability, and nitrate in particular, has been shown to strongly influence Microcystis proliferation, chlorophyll-a synthesis, and toxin production (Gobler et al., 2016; Davis et al., 2010).
In tropical and subtropical regions, where elevated temperatures favor cyanobacterial dominance, nitrate enrichment from agricultural runoff and aquaculture effluents further exacerbates bloom potential (O’Neil et al., 2012). Yet, most studies on nitrate–cyanobacteria interactions have focused on temperate systems, leaving a knowledge gap regarding tropical freshwater isolates. Laboratory-based studies using controlled nutrient gradients are therefore essential for quantifying the specific effects of nitrate on growth kinetics, chlorophyll-a accumulation, and bloom potential in local cyanobacterial strains.
Previous research by Rinta-Kanto et al. (2009) and others has demonstrated that nitrate availability can alter cyanobacterial community composition, with Microcystis often dominating under moderate nitrate levels. Similarly, Li et al. (2018) reported that nitrate enrichment up to an intermediate level enhanced Microcystis aeruginosa growth and photosynthetic activity, beyond which excessive nitrogen led to decreased pigment production and oxidative stress. These findings underline the importance of defining the “optimum nitrate window” for specific species and environmental conditions.
The present study aims to investigate how varying nitrate concentrations influence the growth and chlorophyll-a content of a Microcystis-like cyanobacterium isolated from a freshwater pond. By culturing the isolate under four nitrate levels (0.5, 1, 5, and 10 mg L-1 NO₃⁻-N) and monitoring optical density (OD₆₈₀) and chlorophyll-a over eight days, this experiment seeks to quantify growth kinetics and pigment synthesis responses. The central hypothesis is that moderate nitrate enrichment enhances cyanobacterial productivity, while both deficiency and excess nitrate suppress growth.
This work provides an experimental foundation for understanding nutrient thresholds governing Microcystis proliferation in tropical waters. The outcomes can inform ecological models of bloom prediction and guide freshwater nutrient management practices aimed at minimizing bloom risks. Furthermore, this controlled laboratory approach can be extended to other nitrogen forms (ammonium, urea) and cyanobacterial species to comprehensively assess nitrogen–cyanobacteria interactions in diverse aquatic systems.
Material and Methods
Organism and culture conditions
A unialgal culture of a Microcystis-like cyanobacterium was isolated from surface water samples collected from a eutrophic freshwater pond located near Velur, Namakkal District, Tamil Nadu, India. The pond frequently exhibits greenish surface scums characteristic of cyanobacterial dominance during the dry season. Water samples were transported to the laboratory in sterile, amber glass bottles and processed within 4 hours of collection. Isolation was performed using serial dilution and streak-plating techniques on BG-11 agar plates (Rippka et al., 1979). After several transfers, a unialgal culture (free from visible heterotrophic contamination under microscopy) was established and maintained in liquid BG-11 medium.
Experimental design
The experiment was designed to evaluate the effect of nitrate availability on the growth and chlorophyll-a content of the Microcystis-like isolate. The standard BG-11 medium contains 1.5 g L-1 sodium nitrate (NaNO₃), corresponding to approximately 247 mg L⁻¹ NO₃⁻-N. To simulate environmentally relevant nitrate levels and avoid excessive nitrogen loading, the base medium was modified to obtain four nitrate concentrations: 0.5, 1, 5, and 10 mg L⁻¹ NO₃⁻-N. These correspond to low, moderate, optimal, and high nitrate regimes, respectively.
Each nitrate concentration was prepared in triplicate (n = 3) to ensure statistical reliability. Sterile stock solutions of NaNO₃ were prepared and added aseptically to nitrate-free BG-11 to achieve the desired concentrations. All other macro- and micronutrient components of the BG-11 medium were kept constant to isolate the effect of nitrate.
Experimental cultures were inoculated with exponentially growing cells to an initial optical density (OD₆₈₀) of approximately 0.05, ensuring comparable starting biomass across treatments. Flasks were arranged randomly in the growth chamber to minimize positional effects of light and temperature gradients. Cultures were gently agitated daily to prevent cell clumping and ensure even nutrient exposure.
Growth was monitored over an 8-day incubation period, with sampling on Days 0, 2, 4, 6, and 8. On each sampling day, 3 mL of culture was withdrawn aseptically from each flask, and optical density at 680 nm (OD₆₈₀) was measured using a UV-Visible spectrophotometer (Shimadzu UV-1800). The OD₆₈₀ value serves as a reliable proxy for cyanobacterial biomass, as it corresponds to the chlorophyll absorption maximum and correlates strongly with cell density (Fogg & Thake, 1987). Samples were returned to the flasks after measurement to minimize volume loss.
Chlorophyll-a determination
At the end of the 8-day incubation, chlorophyll-a (Chl-a) content was determined as a biochemical index of photosynthetic pigment accumulation and an indicator of overall physiological performance.
From each culture flask, 5 mL of well-mixed sample was collected and centrifuged at 4,000 rpm for 10 minutes to pellet the cells. The supernatant was discarded, and the pellet was resuspended in 90% acetone to extract chlorophyll pigments. Samples were incubated in the dark at 4 °C for 24 hours to ensure complete pigment extraction while minimizing photodegradation. After extraction, the mixture was centrifuged again, and the clear supernatant was used for spectrophotometric measurement.
Chlorophyll-a concentration was quantified following the method of Jeffrey and Humphrey (1975). Absorbance was measured at 630, 647, and 664 nm, and Chl-a concentration was calculated using the following equation:
Chl-a (µg/mL) = 11.85(A664) − 1.54(A647) − 0.08(A630)
Values were then converted to µg mL-1 or µg L-1 as required. Blanks containing 90% acetone were used to correct for background absorbance.
Data analysis and statistics
For each nitrate treatment, triplicate readings were used to compute the mean ± standard deviation (SD) of OD₆₈₀ and chlorophyll-a concentrations. Growth curves were generated by plotting mean OD₆₈₀ against time (days). The specific growth rate (µ, day⁻¹) during the exponential phase was calculated using the equation:
μ= ln(N2/N1))/(t2 - t1 )
Where; N1 and N2 are the OD680 readings at times t1 and t2, respectively.
One-way Analysis of Variance (ANOVA) was conducted to statistically evaluate the effect of nitrate concentration on final biomass and chlorophyll-a content. Post-hoc comparisons (Tukey’s HSD) were conducted to identify significant differences among treatments (p < 0.05). All data were processed using Microsoft Excel 2021 and visualized in GraphPad Prism 9. Experimental reproducibility was verified by ensuring standard deviations remained low (<10% relative error) across replicates.
Quality control and contamination check
To ensure culture integrity, microscopic observations were made regularly using a compound microscope (×400 magnification). The absence of bacterial contaminants was confirmed by the lack of heterotrophic motile cells or bacterial colonies on nutrient agar plates inoculated with aliquots of the culture medium. pH was monitored at the start and end of the experiment and remained between 7.4 and 7.8, confirming stable medium conditions throughout the incubation.
All measurements were conducted in triplicate, and glassware was acid-washed (10% HCl) and rinsed with distilled water before use to prevent trace nutrient contamination. Illumination intensity was verified weekly using a quantum light meter (LI-COR LI-250A) to maintain uniform irradiance across all treatments.
Results and Discussion
Growth dynamics under varying nitrate concentrations
Growth of the Microcystis-like cyanobacterium varied markedly across nitrate treatments during the 8-day incubation period (Table 1; Fig. 1). Optical density at 680 nm (OD₆₈₀), used as a proxy for biomass accumulation, increased progressively with time in all treatments but differed in magnitude depending on nitrate availability. Cultures grown at 5 mg L-1 NO₃⁻-N exhibited the steepest growth trajectory, reaching a mean OD₆₈₀ of 0.60 ± 0.01 on Day 8. Moderate nitrate enrichment (1–5 mg L-1) supported sustained exponential growth after Day 4, whereas both low (0.5 mg L-1) and high (10 mg L-1) nitrate levels led to slower biomass accumulation and earlier plateauing of growth curves.
At Day 2, growth differences among treatments were minimal (p > 0.05), with OD₆₈₀ values ranging between 0.12 and 0.16. By Day 4, the 5 mg L-1 treatment began to diverge significantly (0.32 ± 0.01) from the 0.5 mg L-1 group (0.24 ± 0.02). A clear nitrate-dependent response was evident by Day 6, when the 5 mg L-1 treatment reached an OD₆₈₀ of 0.48 ± 0.02, nearly double that of the 0.5 mg L-1 condition (0.27 ± 0.01). Excess nitrate (10 mg L-1) did not enhance growth; instead, a modest decline in OD₆₈₀ relative to the 5 mg L-1 group indicated a potential inhibitory effect of high nitrate concentration on cell division or pigment formation.
Growth curves (Fig. 1) clearly illustrate the sigmoidal pattern typical of cyanobacterial batch culture. The lag phase extended through the first two days, followed by a pronounced exponential phase between Days 2-6, and finally a stationary phase beyond Day 6 in low and high nitrate treatments. In contrast, the 5 mg L-1 treatment sustained exponential growth until Day 8, indicating enhanced nutrient utilization efficiency under moderate nitrate supply.
Table 1: Mean optical density (OD₆₈₀) of Microcystis-like cyanobacterium under differe
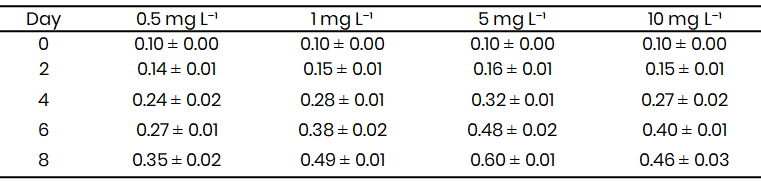
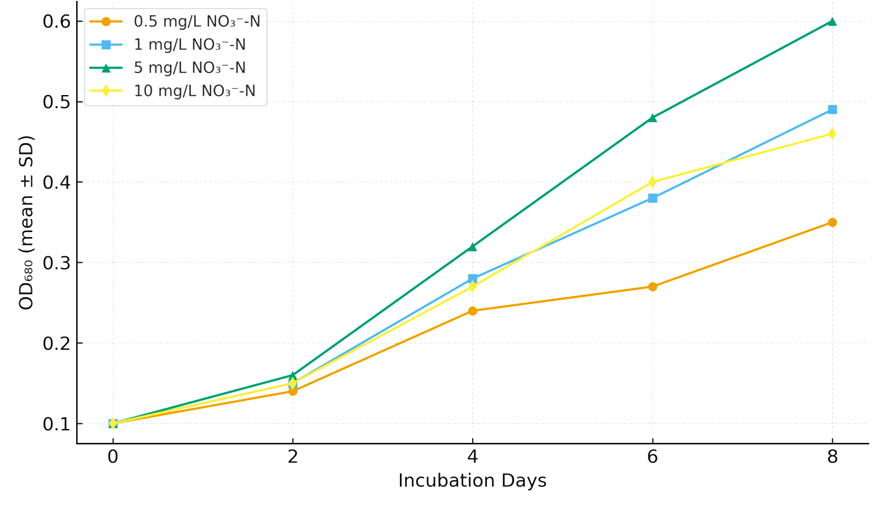
Fig. 1: Growth curves (OD₆₈₀) of Microcystis-like cyanobacterium under different nitrate concentrations (0.5–10 mg
Chlorophyll-a concentration
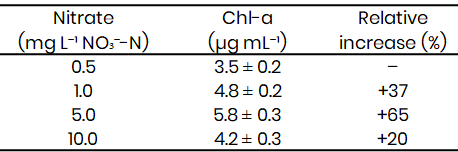
Chlorophyll-a concentrations at Day 8 followed a similar trend to optical density measurements (Table 2). The 5 mg L-1 treatment exhibited the highest pigment accumulation (5.8 ± 0.3 µg mL-1), corresponding to a 65 % increase relative to the 0.5 mg L-1 treatment (3.5 ± 0.2 µg mL-1). The 1 mg L-1 group recorded intermediate values (4.8 ± 0.2 µg mL-1), while pigment content declined slightly under nitrate excess (10 mg L-1; 4.2 ± 0.3 µg mL-1). These results confirm that chlorophyll synthesis in the Microcystis-like strain is optimized within a narrow nitrate concentration range centered around 5 mg L-1.
The pattern indicates that both nitrate limitation and oversupply negatively influence pigment formation, potentially due to metabolic stress or imbalanced nitrogen assimilation. The decline in chlorophyll at 10 mg L-1 may result from osmotic or oxidative stress, which has been reported in other cyanobacteria exposed to nutrient surfeit (Glibert et al., 2016; Paerl & Otten, 2013).
Table 2: Chlorophyll-a concentrations (µg mL⁻¹) in Microcystis-like cyanobacterium after 8 days under varying
Relationship between nitrate concentration and biomass yield
A unimodal relationship was observed between nitrate concentration and final biomass yield of the Microcystis-like cyanobacterium. Biomass, expressed as final optical density (OD₆₈₀), increased with nitrate concentration from 0.5 to 5 mg L⁻¹ NO₃⁻-N, beyond which a decline was observed at 10 mg L⁻¹, indicating growth inhibition at excess nitrate levels. Polynomial regression analysis of Day-8 OD₆₈₀ values (Fig. 2) revealed the following empirical relationship:
OD680 = −0.00826C2 + 0.09327C + 0.35094
Where C represents nitrate concentration (mg L⁻¹ NO₃⁻-N). The fitted curve indicates a maximum biomass yield at approximately 5–6 mg L⁻¹ nitrate, consistent with the observed peak in chlorophyll-a accumulation. This unimodal response reflects an optimal nitrate window for growth, with both nitrate limitation and excess negatively affecting biomass production.
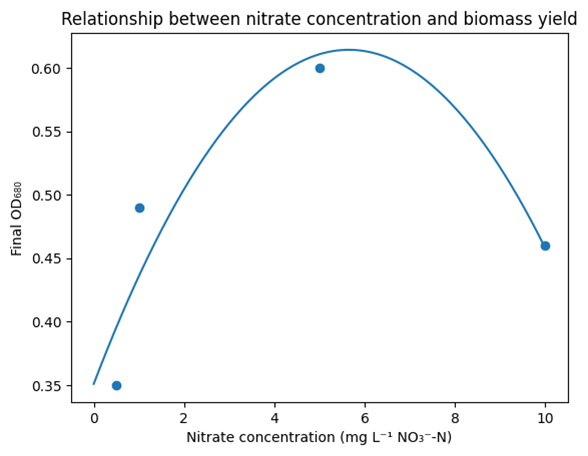
Fig. 2: Nitrate concentration–biomass response curve illustrating the unimodal relationship between nitrate availability and
Visual culture characteristics
Cultures grown under 5 mg L-1 nitrate were bright green and homogeneous, indicating active photosynthetic activity and stable cell suspension. The 0.5 mg L-1 treatment appeared pale green, while the 10 mg L-1 cultures developed a slight yellowish hue toward Day 8, possibly reflecting pigment degradation or reduced phycobiliprotein content under nutrient imbalance.
Moderate nitrate levels (5 mg L-1 NO₃⁻-N) supported the highest growth of Microcystis, confirming that its growth is strongly nitrate-dependent yet sensitive to oversupply. At very low nitrate concentrations (0.5 mg L-1), nitrogen limitation restricted protein and chlorophyll synthesis, while excessive nitrate levels (10 mg L-1) likely caused ionic stress or reduced nutrient uptake efficiency.
Chlorophyll-a concentration showed a strong positive correlation with biomass (r ≈ 0.98), indicating stable pigment-to-biomass ratios up to the 5 mg L-1 treatment; however, beyond this concentration, pigment synthesis efficiency declined, suggesting a metabolic imbalance under nutrient oversaturation.
Ecologically, these results reflect field observations where cyanobacterial blooms commonly occur under moderate nutrient enrichment rather than extreme eutrophication, supporting the view that bloom formation thresholds align with intermediate nitrate levels that optimize growth and photosynthesis. Excessive nitrate inputs may instead favor other phytoplankton taxa or trigger feedback inhibition mechanisms (Glibert et al., 2016).
This laboratory study demonstrates that nitrate concentration critically governs cyanobacterial growth and pigment synthesis. The optimal nitrate concentration for maximum biomass accumulation was approximately 5 mg L-1 NO₃⁻-N. These findings provide insight into nutrient thresholds influencing Microcystis proliferation and can inform nutrient management strategies to mitigate bloom risks.
References
Codd, G. A., Morrison, L. F., & Metcalf, J. S. (2005). Cyanobacterial toxins: Risk management for health protection. Toxicology and Applied Pharmacology, 203(3), 264–272. https://doi.org/10.1016/j.taap.2004.02.016
Davis, T. W., Berry, D. L., Boyer, G. L., & Gobler, C. J. (2010). The effects of temperature and nutrients on the growth and dynamics of toxic and non-toxic strains of Microcystis during cyanobacterial blooms. Harmful Algae, 9(5), 715–725. https://doi.org/10.1016/j.hal.2010.05.013
Flores, E., & Herrero, A. (2005). Nitrogen assimilation and nitrogen control in cyanobacteria. Biochemical Society Transactions, 33(1), 164–167. https://doi.org/10.1042/BST0330164
Fogg, G. E., & Thake, B. (1987). Algal Cultures and Phytoplankton Ecology (3rd ed.). University of Wisconsin Press.
Glibert, P. M., Wilkerson, F. P., Dugdale, R. C., Raven, J. A., Dupont, C. L., Leavitt, P. R., Parker, A. E., Burkholder, J. M., & Kana, T. M. (2016). Pluses and minuses of ammonium and nitrate uptake and assimilation by phytoplankton and implications for productivity and community composition. Limnology and Oceanography, 61(1), 165–197. https://doi.org/10.1002/lno.10203
Gobler, C. J., Burkholder, J. M., Davis, T. W., Harke, M. J., Johengen, T., Stow, C. A., & Van de Waal, D. B. (2016). The dual role of nitrogen supply in controlling the growth and toxicity of cyanobacterial blooms. Harmful Algae, 54, 87–97. https://doi.org/10.1016/j.hal.2016.01.010
Harke, M. J., & Gobler, C. J. (2013). Global transcriptional responses of Microcystis aeruginosa to nitrogen stress, phosphorus stress, and growth on organic matter. PLOS ONE, 8(7), e69834. https://doi.org/10.1371/journal.pone. 0069834
Jeffrey, S. W., & Humphrey, G. F. (1975). New spectrophotometric equations for determining chlorophylls a, b, c₁, and c₂ in higher plants, algae, and natural phytoplankton. Biochemie und Physiologie der Pflanzen (BPP), 167(2), 191–194.
Li, M., Zhu, W., Gao, L., Chen, H., & Zhang, Q. (2018). Effects of different nitrogen forms on growth, toxin production, and gene expression in Microcystis aeruginosa. Environmental Science and Pollution Research, 25(1), 548–557. https://doi.org/10.1007/s11356-017-0398-2
O’Neil, J. M., Davis, T. W., Burford, M. A., & Gobler, C. J. (2012). The rise of harmful cyanobacteria blooms: The potential roles of eutrophication and climate change. Harmful Algae, 14, 313–334. https://doi.org/10.1016 /j.hal.2011.10.027
Copyright
Open Access: This article is licensed under a Creative Commons Attribution 4.0 International License, which permits use, sharing, adaptation, distribution and reproduction in any medium or format, as long as you give appropriate credit to the original author(s) and the source, provide a link to the Creative Commons license, and indicate if changes were made. The images or other third party material in this article are included in the article’s Creative Commons license, unless indicated otherwise in a credit line to the material. If material is not included in the article’s Creative Commons license and your intended use is not permitted by statutory regulation or exceeds the permitted use, you will need to obtain permission directly from the copyright holder. To view a copy of this license, visit http://creativecommons.org/licenses/by/4.0/.

