The impact of resource efficiency on castor production in the Banaskantha District of Gujarat
Abstract
The Government of India considers the cost of agriculture as an important budgetary indicator. Therefore, this study was conducted to examine the rates of development in the area, production, and productivity, as well as the efficiency of resource utilisation in the cultivation of castor crop in the Banaskantha district of Gujarat state. The researchers utilised a multistage sampling strategy to choose the farms. An analysis was conducted on the talukas with the largest area dedicated to cultivating castor crops. One hundred farmers were chosen at random for this experiment. The data was analysed using analytical tools such as the Cobb Douglas production function and exponential growth function.
The study revealed that the compound growth rates (CGRs) for the area, production, and productivity of castor crops in the Banaskantha district have shown positive and highly significant trends over the past twenty years, with growth rates of 3.53%, 5.86%, and 2.24% respectively. However, the area under castor cultivation in both the Banaskantha district and the entire state of Gujarat has experienced negative growth rates of -4.09% and -0.9585% respectively over the past ten years. The MVP/FC ratio for the cost of human work, bullock and tractor charges, cost of manure, and cost of fertiliser and plant protection were calculated to be 3.66, 4.19, 2.84, 2.62, and 1.27 correspondingly. These values indicate that these resources were utilised inefficiently, with an underuse of resources. The negative cost-to-seed ratio suggests that there was an over usage of seeds. Additionally, the irrigation expenses of 0.82 indicate an overuse of this resource. The total of regression coefficients (Σbi's) was 1.035, which suggests that there is a rising return to scale (stage-I) on castor farms. Therefore, it is necessary to enhance the allocation of resources that were not fully utilised and decrease the allocation of resources that were excessively utilised in order to maximise the yield from castor production.
Introduction
The agriculture scenario of the country in general and Gujarat State, in particular, is changing over the years. Gujarat is one of the leading producers of agricultural crops in the country and known for its varied agro-climatic conditions and cropping pattern (Aqaayar et al., 2019; Sinha et al., 2019). There is huge scope to increase the area and production of castor crop in the Banaskantha as well as in the state (Salve et al., 2017). But this crop has some associated problems which hamper growth. The information on resource use efficiency and input utilization pattern will be useful to the crop growers in a reallocation of their resources to improve the production of castor crop (Kumar et al., 2016; Sujan et al., 2017). The results of the study give information on growth and resource use efficiency which would be useful to the producers, researchers, and policymakers to take appropriate measures to improve productivity of castor (Veeranagouda et al., 2011). Hence, the present study was undertaken to analyse growth and resource use efficiency of castor cultivation in Banaskantha district of Gujarat state with the aiming to assess Banaskantha district castor crop growth, production, and productivity and castor crop resource usage efficiency.
Material and Methods
The current investigation was conducted in the Banaskantha district located in North Gujarat. In order to assess the goals of the study, data were gathered from primary and secondary sources. The researchers employed a multistage sampling technique to choose the farmers for the study. The Banaskantha district was deliberately chosen for the study due to its favourable agro-climatic conditions and soil types for growing castor crops. For the second stage, Palanpur taluka was deliberately chosen due to its largest cultivated area of castor crop compared to other talukas in the Banaskantha district. During the third step, a random selection was made of five villages from the pool of villages where castor is grown in the taluka. During the ultimate phase, 20 farmers were randomly chosen from those who have cultivated the castor crop, to be selected as representatives from each of the chosen communities. Hence, a total of 100 farmers engaged in castor cultivation were selected at random from the Banaskantha area for the purpose of this study.
2.1 Data Analysis
The exponential function was used for measurement of trend and the Compound Annual Growth Rate (CGR) of yield, area and total production of castor cultivation. The production and income of farmers from cultivation of castor crop were influenced by various factors. Therefore, the production function approach will be used to find out the efficiency of resources used in the cultivation of castor crop. For this purpose, the Cobb-Douglas production function was employed. For achieving the specific objective of the study, the Cobb-Douglas form of production function was estimated taking gross income as dependent variable and cost of human labour, bullock and tractor charges, cost of manures, cost of fertilizer, the value of seeds, cost of irrigation and cost of plant protection as independent variables of selected crops. The Cobb-Douglas production function was employed as below:
Y = a • X1b1• X2b2• X3b3• X4b4• X5b5• X6b6• X7b7• U…….(1)
Where, Y = Gross income (₹)
a = Intercept
X1 = Cost of human labour (₹)
X2 = Bullock and tractor charges (₹)
X3 = Cost of manures (₹)
X4= Cost of fertilizer (₹)
X5 = Cost of seeds (₹)
X6 = Cost of irrigation (₹)
X7 = Cost of plant protection (₹)
bi = Production elasticity of respective inputs (Xi’s), n
Σ bi = Returns to scale, and i=1
Ut = Error term with usual assumptions
Results and Discussion
The results of the various aspects are presented under the following heads.
3.1 Growth in Area, Production, and Productivity of castor crop
For the computation of Compound Annual Growth Rate (CAGR) of area, production and productivity of castor in Banaskantha district, as well as Gujarat state data, were collected from the year 2000-01 to 2019-20. It is divided into three Periods, Period - I (2000-01 to 2009-10), Period-II (20010-11 to 2019-20), and overall Period (2000-01 to 2019-20).
It is evident from the Table 1 the compound growth rates (CAGR) of castor crop in Banaskantha district were found positive and highly significant i.e., 3.53 % for area, 5.86 % for production and 2.24 % per annum for yield during last twenty years (2000-01 to 2019-20). In case of Gujarat state, there was positive and highly significant compound growth rates 7.28 %, 2.16 %, 5.01 % were recorded for yield of castor, production and area of castor during this period (2000-01 to 2019-20) respectively. It indicates that the trend of production of castor in Banaskantha district and the Gujarat state was expended due to rise in both area and productivity.
The period wise growth rate revealed that from the year 2010-11 to 2019-20 (period-II), the compound growth rates of castor in Banaskantha district were estimated -4.09 % for area and -2.32 % per annum for production and at Gujarat state level, it was also found negative -0.95 % and -0.33 % per annum, respectively. This is mainly due to the diversification of crops. Considering the period wise growth, the area and production growth showed a decline trend in period-II as compared to period-I. But during the period-II, the yield growth was raised, this might be due to the adoption of new high yielding seed varieties and new technology in castor cultivation, the farmers gained higher production per unit despite slight change in area. This decline change in area was affected in change in crop growing pattern of castor grower in study area.
It may be concluded that area under castor, production and yield of castor in Banaskantha and the Gujarat state increased significantly in the overall period (2000-01 to 2019-20). The period wise growth rate analysis revealed that during the period-II (2010-11 to 2019-20), the growth rates of area of castor and production showed negative growth while productivity achieved positive growth in castor in Banaskantha district.
Table 1: Compound growth rate (CGR) of castor in Banaskantha district and Gujarat state

Resource Use Efficiency of Castor Cultivation
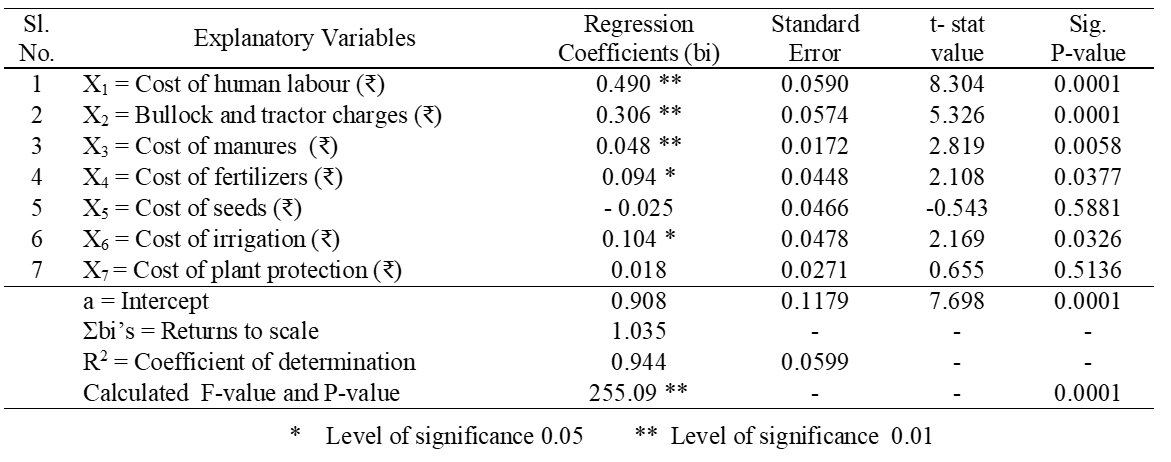
The regression co-efficient of inputs used for castor production were obtained from the Cobb Douglas production function for sample farmers are presented in Table 2.
It is seen from Table 2 that the value of regression co-efficient of production was found negative as well as positive. The value of co-efficient of production of castor was ranged from -0.025 (cost of seeds) to 0.490 (cost of human labour). It is inferred that among the explanatory variables of castor production, the value of co-efficient of cost of human labour (X1 = 0.490), bullock and tractor charges (X2 = 0.306) and cost of manure (X3 = 0.048) were positive and highly significant while in case of cost of fertilizers (X4 = 0.094) and cost of irrigation (X6 = 0.104) were positive and significant showing positive impact on gross income of castor. The cost of seeds explained negative (X5 = -0.025) and non-significant indicated negative impact on gross income of castor, whereas the cost of plant protection (X7 = 0.018) explained positive, but non-significant showing positive impact on gross income of castor.
The co-efficient of multiple determinations (R2) was 0.944 indicating that 94 % of the total variation in the gross income from castor was explained by the explanatory variables included in the function. The sum of regression co-efficient (Σbi’s - return to scale) was more than one (1.035) in castor cultivation indicating increasing return to scale. Thus, it can be concluded that gross return from castor crop proportionately increased at increasing rate with raise in the variable factors.
Table 2: Estimated Cobb Douglas production function for castor
3.3 Efficiency Levels of Inputs Utilised In Castor Cultivation
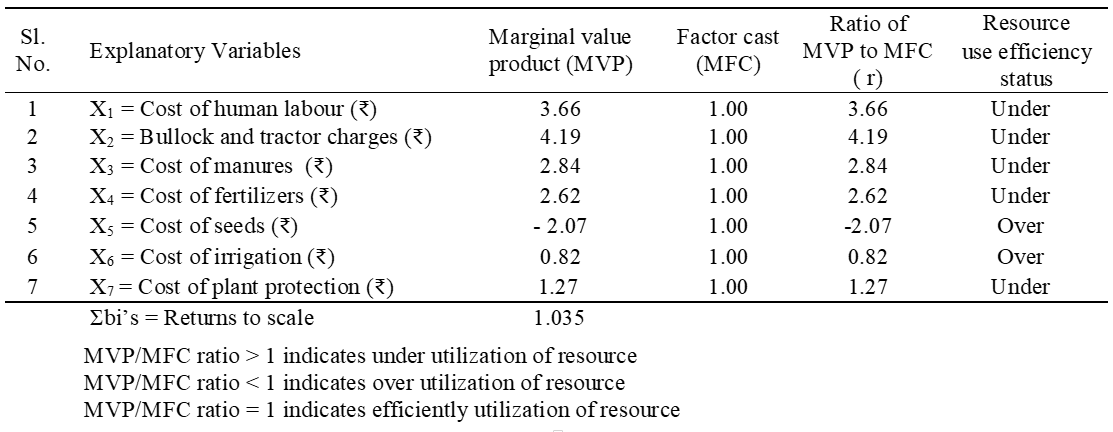
For evaluating the efficiency of resource use, the ratio of the marginal value products (MVP) to marginal factor cost (MFC) for all variables were calculated and the findings are given in Table 3.
The MVP/MFC ratio of bullock and tractor charges, cost of human labour, cost of manure and cost of fertilizer and plant protection were estimated 4.19, 3.66, 2.48, 2.62 and 1.27 respectively. These values were positive and more than one indicating those resources were used inefficiently i.e., underutilized.
The production function analysis of castor gave negative value of MVP/MFC ratio of cost of seeds (-2.07) indicated excessive use of this resource, while MVP/ MFC ratio was less than one in case of irrigation (0.82) showed over use of this resource in castor cultivation. Therefore, castor farmers can raise gross returns by reducing cost of seeds and cost of irrigation.
It can be concluded that the above resources use analysis in castor farms indicated that there is considerable scope for raising the efficiency of resources use in castor by readjustment of resources. Hence, the resources which were underutilized should be increased and those which were over utilized should be reduced in order to optimize the return from castor production.
Table 3: Marginal value product (MVP) to marginal factor cost (MFC) ratio for castor cultivation
Conclusion
- The compound growth rates for the area, production, and productivity of castor crops in the district were positive and highly significant i.e., 3.53, 5.86, and 2.24 % respectively during the last twenty years whereas the area under castor in Banaskantha district and Gujarat state level, however negative compound growth rate (-4.09 % and -0.9585 %) was found over last ten years, respectively. Therefore, considering the agro climatic condition of the district, efforts should be made by the policy maker to increase the area and productivity of the castor crop.
- Among the explanatory variables, the value of elasticity of cost of human labour and bullock and tractor charges, cost of manure, fertilizer and cost of irrigation were positive and significant showing positive impact on gross income of castor while the cost of seeds explained negative and non-significant indicated a negative impact on the gross income of castor.
- The MVP/FC ratio of cost of human labour, bullock and tractor charges, cost of manure and cost of fertilizer and plant protection were 3.66, 4.19, 2.84, 2.62 and 1.27 respectively, indicating these resources were used inefficiently (under use of resources). Therefore, the gross returns can be increased by using more of these five inputs in castor cultivation.
- The negative ratio of cost of seeds indicated excessive use while it was less than one in case of irrigation (0.82) showed over use of these resources in castor cultivation. Therefore, farmers can increase gross returns by reducing these two resources.
- The sum of regression co-efficient (Σbi’s) was 1.035 (more than one) indicating increasing return to scale (stage-I) on castor farms. Hence the resources which were underutilized should be increased and those which were over utilized should be reduced in order to optimize (maximizing) the return from castor production. Therefore, there is an enough potentiality of raising castor production by readjustment of resources.
Copyright
Open Access This article is licensed under a Creative Commons Attribution 4.0 International License, which permits use, sharing, adaptation, distribution and reproduction in any medium or format, as long as you give appropriate credit to the original author(s) and the source, provide a link to the Creative Commons license, and indicate if changes were made. The images or other third party material in this article are included in the article’s Creative Commons license, unless indicated otherwise in a credit line to the material. If material is not included in the article’s Creative Commons license and your intended use is not permitted by statutory regulation or exceeds the permitted use, you will need to obtain permission directly from the copyright holder. To view a copy of this license, visit http://creativecommons.org/licenses/by/4.0/.

