Assessing morphological and physiological responses of local and exotic Rice varieties to salinity stress
Abstract
This study aimed to evaluate the differential morphological and physiological responses of local and exotic rice varieties growing in arid and semi-arid climates under soil salinity stress. The experiment was laid out in a Completely Randomized Design (CRD) with four replicates and conducted in a greenhouse under natural conditions at the Department of Soil and Environmental Sciences (lath house), Faculty of Agriculture and Environmental Sciences, MNS-University of Agriculture, Multan, Pakistan, during 2023. The pot experiment involved two exotic rice varieties (BR-61 and BR-47) and one local variety (Al-Khalid), tested under two salinity treatments: control (non-saline) and saline (EC = 10 dS m⁻¹). Data on various growth parameters - such as shoot and root length, shoot and root fresh and dry weights, chlorophyll content, and ionic concentrations (Ca²⁺, Na⁺, and K⁺) in leaf tissues - were collected and analyzed statistically using factorial CRD. The results indicated that exposure to NaCl stress significantly reduced shoot and root growth while increasing Na⁺ concentration in the plants. Among the tested varieties, BR-61 exhibited the highest shoot and root dry weight (8.0 g and 1.0 g, respectively), while BR-47 showed the lowest root dry weight (5.6 g and 0.6 g). The maximum Na⁺ concentration (348.7 ppm) in leaf sap was observed in Al-Khalid, which was approximately twice the control, while the minimum (157.4 ppm) was found in BR-61. BR-61 also recorded the highest K⁺ concentration (77.1 ppm), while BR-47 had the lowest (62 ppm) under saline conditions. Based on the findings, the rice varieties were classified into salt-tolerant (BR-61) and moderately tolerant (BR-47 and Al-Khalid) categories at the 10 dS m⁻¹ NaCl level. These insights could be valuable in formulating strategies to enhance salinity stress tolerance in rice varieties and optimize their physiological performance, particularly chlorophyll content, under saline conditions.
Introduction
Salt-affected agricultural lands are a major hurdle in the way of sustainable agriculture as well as food production (Syed et al., 2020). Consequently, saline soils and Sodic soils are the serious drawbacks of crop production in arid and semi-arid regions where the annual precipitation rate is very low in comparison of higher evaporation rates and the main causes of this problem are severe climate events along with use of brackish water for irrigation (Ahmad et al., 2013). About 955 Mha land around the globe is under salt stress out of which Pakistan’s 6.68 Mha arable land is affected with soil salinity (Khan, 1998). Pakistan and other countries of the world are facing a change in food security and an increased demand of food for growing population. It has been reported that Pakistan is facing 14% irrigated land losses and 64% yield losses due to soil salinity, leaving behind only 23 Mha land suitable for agricultural production (Irum and Ehetisham-ul-Haq, 2017). Soil salinization has severely damaged about 2.5 Mha of total irrigated land area. Furthermore, it is also estimated that 4.5 Mha area of Pakistan out of its total geographical area of 79.61 Mha is under the effect of soil salinization (Aslam, 2016). Salinity is an abiotic stress condition which hampers the proper growth and production of plants (Parvaiz, 2014). Higher the salinity more will be the Na+ or Cl- ions uptake by the plant which results in injury, burning and premature death of cells (Wahome et al., 2001). Due to soil salinity seed germination, seedling growth and crop growth has been affected adversely and cause up to 70% yield loss of wheat, maize, barley and rice (Veatch-Blohm, 2007). Primarily, under salt stress water deficiency, osmotic pressure, ion toxicity and nutritional imbalance cause decreased growth rate. Although, there is sufficient water available in the soil but under salinity stress plant roots unable to absorb water from the soil solution (Sakina et al., 2016). All these effects of salinity on crop results in imbalance of nutrients, membrane leakage, inhibition of enzymatic activities, metabolic malfunctioning and inhibition of growth regulators and photosynthesis ultimately ends up with plant demise (Hasanuzzaman et al., 2013). Moreover, under high salinity stress, for the maintenance of water balance and protection of cell structures, plants biosynthesize of osmo-protectants and compatible solutes such as proline and glycine betaine (Mittal et al., 2012) and to counteract the oxidative stress due to ROS plants increase the synthesis of antioxidant enzymes (superoxide dismutase and catalase) and compounds (Gupta and Huang, 2014).
Production of imperative crops like rice is important to fulfill the food demand of the world as rice is a cereal crop (Shah et al., 2020). It is a crop that is widely consumed by global population after wheat and maize as three of them are major food crops of the world and proved to be a source of calories for about 3.5 Billion people. It has proved that a 100g of rice is a good source of carbohydrates (78.2g), protein (6.8g) and energy (345.0 Kcal) (Aykroyd et al., 1963). Rice is generally sensitive to soil salinity with the threshold level of 3.0 dSm-1; however, it is moderately tolerant to soil sodicity (ESP 20-40%) (Maas and Hoffman, 1977). During vegetative stage and then at reproductive stage rice show sensitivity to salinity, while at germination stage it shows resistance to salinity up to 16.3 dSm-1 (Ali et al., 2014). Despite its sensitivity to salinity rice – wheat crop rotation is recommended during reclamation because of its ability to grow well under flooded conditions, and because the standing water in rice fields can help leach salts from the soil profile (Chand et al., 1978). A considerable genetic variability has been observed among and even within rice germplasm (Yeo and Flowers, 1980) and this variation can be exploited to select and develop salt tolerant rice varieties. Multiple research studies have shown that the intake and absorption of micro- and macro-mineral nutrients change when plants are subjected to high salinity levels, resulting in higher Na transport to the shoots and reduced intake of K, Zn, and P (Razzaq et al., 2019). Similarly, it has been noted that an excess of salt leads to elevated reactive oxygen species (ROS) levels, resulting in considerable harm and eventual mortality in plants (Chawla et al., 2012). The production and build-up of compatible solutes such as proline, glycine betaine, trehalose, polyols are necessary to counteract the osmotic pressure caused by high salinity (Chen and Murata, 2002). The production of these compatible solutes is frequently linked to salt tolerance in rice (Zhao et al., 2014). Applying compatible solutes from external sources or increasing the expression of relevant genes related to osmolytes production can enhance rice's ability to tolerate salt (Garg et al., 2002). Therefore, existing local and exotic rice varieties can be screened to select and develop favorable salt tolerant varieties of rice to grow on salt affected lands with minimal yield reduction.
The objectives of this study were to classify promising exotic and local rice varieties based on different morphological and physiological traits and to assess the response of different growth parameters against salinity stress by establishing the relationship between ion concentration and salinity tolerance in order to manage salt-affected lands cost-effectively. This research aimed to bridge the knowledge gap in local and exotic varieties of rice response towards salinity stress.
Material and Methods
Experimental site, design and treatment plan
The reported experiment was conducted in Lath house without any environmental control at Department of Soil and Environmental Sciences, Faculty of Agriculture and Environmental Sciences, MNS-University of Agriculture, Multan, Pakistan during the year 2023. The coordinates of the location were 71.4° E Longitude and 30.2° N Latitude. The study was carried out as CRD with factorial arrangement in soil filled pots. There were 03 varieties of rice and 01 salinity level (Control (Non-saline), EC = 10 dS m-1) in reported experiment. Randomization of the four replications of each variety was done in all the treatments.
Plant material
Varieties were signified as follows: (Local + Kernel) V1 = Al-Khalid, (Exotic + Coarse) V2 = BR-47 and V3 = BR-61. The seeds of rice were obtained from the Soil Salinity Research Institute (SSRI), Pindi Bhattian, Pakistan (Local) and International Center for Biosaline Agriculture (ICBA), Dubai (Kernel). The nursery of rice seeds was sown on 27th July, 2023 in the plug trays containing thoroughly washed fine river sand. The trays were placed on the bench top in the net house and watered regularly till transplantation.
Growth conditions and salinity development
Nursery of rice plants was grown in the sand culture. The seedlings of rice at the three leaf stage were transferred into the pots filled with 08 Kg soil (Sandy Loam). Cloth screens were placed in the bottom of the pots to prevent soil loss. A population of four plants per pot was maintained. One pot was considered as one replication, and each treatment contained four pots of each variety. Thus, a total of 24 pots were maintained. Transplanted seedlings were kept well irrigated in the greenhouse during the growth period. Soil was fertilized using an adequate dose of fertilizers (N, P2O5, K2O, ZnSO4 @ 150-90-50-7 (Kg ha-1)) at basal stage. The soil was salinized using NaCl salt to develop an ECe of 10 dS m-1 and puddled before transplanting of rice seedlings, whereas soil without any salt treatment (ECe = 1.58 dS m-1, pH = 8.2) was used as control. All cultural practices were carried out regularly throughout the growing period.
Data collection
Plants were harvested 90 days after exposure to (ECe of 10 dS m-1) NaCl salinity stress and separated into the shoots and roots. After harvesting, roots were thoroughly washed with distilled water to remove adhered soil and patted on tissue paper to remove excess water and shoots were patted on paper towel to remove dirt and excess moisture. The shoot length of each plant was measured in cm using meter rod from base to top and average of all replicates were calculated. Afterwards, roots were cut off from the shoot and lengths were measured in cm using measuring tape and means of every replicate were calculated. The fresh weight of roots and shoots were separately recorded in g by using a portable analytical balance immediately after harvesting. In order to measure dry weights, plants were placed in a drying oven at 65℃ for 72 hours. After moisture removal, shoot and root dry weights were recorded separately in g by using analytical balance. For chlorophyll content determination in rice plants, SPAD meter (model: SPAD-502 Plus made by Konica Minolta, Europe) was used and SPAD values were recorded. For checking the variation in SPAD values chlorophyll content was checked twice with a gap of two weeks. Moreover, in order to determine the ions concentration (Na+, K+ and Ca2+), 2nd fully expanded leaf from the top of the plant was taken and cell sap was extracted using centrifuge machine and then the sap of leaves was used to determine Na+, Ca2+, and K+ concentration in ppm by using Flame photometer.
Statistical analysis
All the recorded data were analysed using Analysis of Variance (ANOVA) technique following the Completely Randomized Design (CRD) under factorial arrangement by using Statistix 8.1 (Taylor-Powell and Steele, 1996). The means were compared by using the least significant difference (LSD) test at a 5% probability level.
Results and Discussion
Effect of salinity on morphological parameters
Shoot length (cm)
The data related to variation in shoot length of different rice varieties under salinity stress was shown in (Fig. 1A) and clearly showed that variation in shoot length at salinity stress was highly significant (P= .05). Under saline conditions, all varieties experience a reduction in shoot length compared to control condition, however, variations in plant height of three rice varieties were may be due to their genetic variability. At salinity stress of EC = 10 dS m-1 maximum shoot length (57 cm) was recorded in variety BR-61 followed by BR-47 (54 cm), while minimum was found in Al-Khalid (52 cm), which accounts for lowest decrease of 11% in BR-61 variety followed by BR-47 with 23% and highest decrease of 25% in Al-Khalid variety when compared with control. Salinity stress impacted both the ultimate size of the cells and the speed at which new cells were produced, leading to a decline in plant height (Reddy et al., 2017).
Shoot fresh weight (g)
The (Fig. 1B) depicted the data related to changes in shoot fresh weights of different rice varieties which clearly shown that effect of salinity stress on three varieties of rice was highly significant (P= .05). NaCl stress noticeably affected the shoot fresh weights of all rice varieties when compared to non-saline condition, although variation among three varieties of rice had been observed markedly. At NaCl stress of 10 dS m-1, highest shoot fresh weight was witnessed in variety BR-61 (15.2 g) and also followed by Al-Khalid (12.6 g) while lowest shoot fresh weight was exhibited by BR-47 (11.6 g) variety of rice. Hence, 14% of minimum reduction in fresh weight was observed in BR-47 followed by 24% reduction in variety BR-61, whereas maximum decrease of 28% was examined in rice variety Al-Khalid. Jamil et al. (2010) reported that the reason behind the decrease in shoot fresh weight in saline environments was due to reduced water absorption, toxicity of sodium and chloride in plant cells, and decreased photosynthesis.
Shoot dry weight (g)
The (Fig. 1C) represented the data about the effect of salinity stress on shoot dry weights of three rice varieties which markedly demonstrated that the response of all rice varieties and salinity level is statistically highly significant (P= .05). At salinity level of 10 dS m-1, there was a decrease in shoot dry weight across all rice varieties compared to non-saline control, however, variation in shoot dry weights of all three varieties of rice was observed under NaCl stress. When exposed to salt stress, higher shoot dry weight (8.0 g) was recorded in variety BR-61 (reduced 23% from control) followed by Al-Khalid (6.6 g) variety (32% of highest reduction from control), while, lower shoot dry weight (5.6 g) was observed in BR-47 variety (24% reduction from control). Zeeshan et al. (2020) reported that the main cause of serious decline in shoot dry weight is excessive increase in salinity levels.
Root length (cm)
The data related to the root lengths variation of three different rice varieties is illustrated in the (Fig. 2A) which evidently shown the effect of salinity stress on different rice varieties is statistically significant (P= .05). When exposed to saline conditions, there was a significant reduction in root lengths for all rice varieties when compared to control, however, the variation among different varieties was may be due to genetically different rice varieties. At salinity stress of 10 dS m-1, maximum root length was observed in BR-61 (10.3 cm) variety and followed by variety BR-47 (9.3 cm), while minimum root length was recorded in Al-Khalid (8.4 cm) variety. Furthermore, it was found that the minimum reduction in root length of varieties BR-61 and BR-47 was 17%, whereas, for variety Al-Khalid it was 18% as compared to control. The reason for the reduction in root lengths could be attributed to salt stress inhibiting photosynthesis, leading to a decrease in carbohydrate supply for growth, lower water potential due to reduced turgor, and disrupted mineral supply affecting growth (Sabagh et al., 2019).
Root fresh weight (g)
The following data related to root fresh weight of different varieties of rice under salinity stress is illustrated in (Fig. 2B) which visibly represented that the effect of added salts on root fresh weight of three rice varieties was highly significant (P=.05). When compared to control, there was significant reduction in root fresh weight of three rice varieties at the exposure to excessive salts. At salinity stress (EC = 10 dS m-1), minimum root fresh weight (1.5 g) was perceived in varieties BR-47 and Al-Khalid, representing a decrease of 33% for Al-Khalid and 28% for BR-47, while maximum root fresh weight (2.0 g) was recorded in BR-61 variety translating to a decrease of 28% when compared to control. The reasons for the decrease in root fresh weight in rice may include cell content reduction, diminished tissue development and differentiation, inadequate nutrition, membrane damage, and disrupted avoidance mechanisms (Saeedpour, 2014).
Root dry weight (g)
Variations in root dry weights of different rice varieties under salinity stress is shown in (Fig. 2C), while effect of different salinity levels on root dry weights of rice varieties was highly significant (P= .05). Salinity affected root dry weight of all the varieties of rice compared to controlled treatments. Due to salinity, root dry weight of all varieties was decreased compared to control. At salinity stress of 10 dS m-1, maximum root dry weight (1.0 g) was observed in BR-61 accompanied by Al-Khalid variety (0.7 g); however minimum root dry weight (0.6 g) was recorded in BR-47 variety. Hence, 40% of minimum reduction in root dry weight was observed in BR-61 and BR-47, whereas maximum decrease of 42% was examined in rice variety Al-Khalid. Root dry weights hold the same reason of reduction as observed previously in case of root fresh weight of the plant.
Effect of salinity on physiological parameters
Chlorophyll content (SPAD value)
Variations in SPAD value (Soil Plant Analysis Development) of three varieties of rice under salinity stress is shown in (Fig. 3A) which evidently displayed the response of salinity levels on chlorophyll contents of rice was statistically significant (P= .05). Chlorophyll contents of all the varieties of rice are affected by salt stress compared to controlled treatments. The decrease in chlorophyll levels is likely caused by the hindering impact of various salt ions build-up on the production of different chlorophyll types (Djanaguiraman and Ramadass, 2004). When exposed to the high salinity condition, all three varieties experience a notable reduction in chlorophyll content compared to non-saline. Maximum chlorophyll contents (33.3) were observed in variety BR-61 (13% of minimum reduction from control), while minimum chlorophyll contents (27.5) were recorded in BR-47 (22% of reduction from control) and Al-Khalid (26% of highest reduction from control). Ali et al. (2004) reported that due to the membrane-bound chloroplast's dependence on the stability of the membrane, chlorophyll reduction was observed in high salinity conditions where the membrane stability is often compromised.
Na+ concentration (ppm) in leaf sap
The data related to changes in Na+ concentration of different rice varieties under salinity stress is shown in (Fig. 3B). It displayed that effect of different salinity levels on Na+ uptake of rice is also statistically highly significant (P= .05). Salinity affected Na+ uptake in all the varieties of rice compared to controlled treatments. However, variations in Na+ concentrations were observed due to genetic variations in rice varieties. Due to salinity, Na+ concentration of all varieties was increased compared to control. Na+ levels in leaf tissues exhibited a proportional increase with varying levels of salinity (Hakim et al., 2014). At salt stress of 10 dS m-1, maximum Na+ concentration (348.7 ppm) with 3 folds increase from control was calculated in Al-Khalid variety. While minimum Na+ concentration (177.4 ppm) with 2 folds increase from control for BR-47 and that for variety BR-61 was (157.4 ppm) with increase of 1.5 folds was recorded.
K+ concentration (ppm) in leaf sap
Variations in K+ concentrations of different varieties of rice under salinity stress is shown in (Fig. 3C) which undoubtedly shows that response of three rice varieties and effect of salinity level was statistically highly significant (P= .05). Salinity affected K+ concentration in all the three rice varieties compared to controlled treatments. However, changes in K+ concentrations were observed due to genetic variations in rice varieties. Due to salinity, K+ concentration of all genotypes was increased compared to control (Fig. 3C). At salt stress of (10 dS m-1) NaCl, maximum K+ concentration (77.1 ppm) with 47 % minimum increase was observed in BR-61 variety followed by Al-Khalid (74.6 ppm) with a maximum increase of 75% as compared to control. While, minimum K+ concentration (62 ppm) with 59% increase was recorded in rice variety BR-47. Hakim et al. (2014) described that plants with more K+ion accumulation was less affected with Na+ ions and decrease in K+/Na+ ratio concentration due to salinity stress.
Ca2+ concentration (ppm) in leaf sap
The information associated to variations in Ca2+ concentration of diverse rice varieties under salinity stress is shown in (Fig. 3D) which clearly exhibits that response of salinity levels on Ca2+ concentration of rice was also statistically highly significant (P= .05). Salinity affected Ca2+ concentration in all the varieties of rice compared to controlled treatments. Due to salinity, Ca2+ concentration of all varieties was decreased compared to control (Fig. 3D). At NaCl stress of 10 dS m-1, the BR-47 and BR-61 varieties showed equal concentrations (24.3 ppm) indicated no significant difference between them under saline stress and showed the reduction of 57% when compared to control, while Al-Khalid variety had the lowest Ca2+ concentration under saline conditions (22.8 ppm) with 58% maximum reduction compared to non-saline control. The results align with the discoveries of Razzaque et al. (2009), Summart et al. (2010). Ca2+ is crucial in the formation of new cell walls, especially in the middle lamellae that divide newly created cells, therefore the rice membrane experienced increased permeability because Ca2+ was displaced and Na+ levels rose in the phospholipids binding sites, leading to damage (Momayezi et al., 2009).
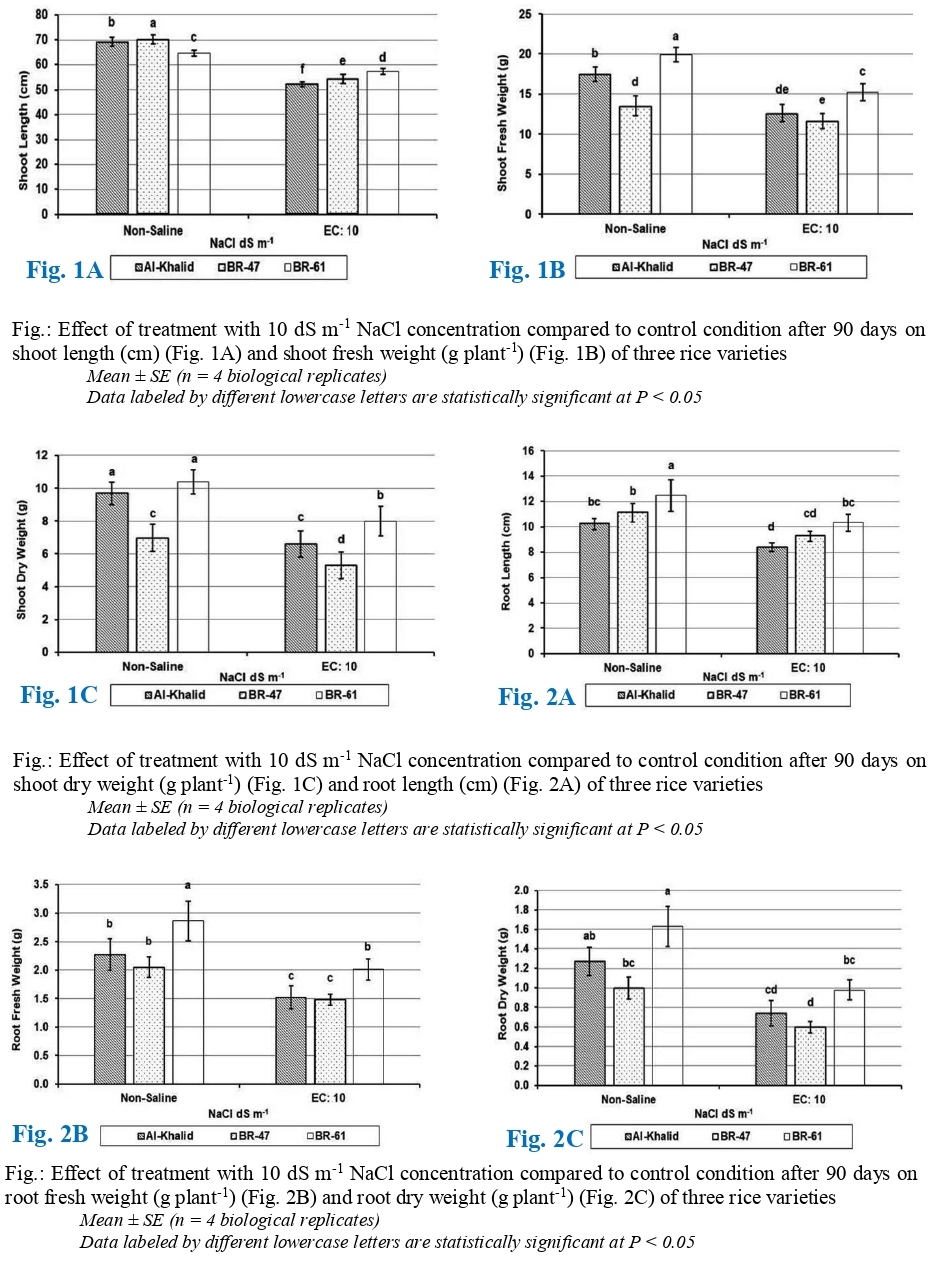
Fig.: Effect of treatment with 10 dS m-1 NaCl concentration compared to control condition after 90 days on shoot length (cm) (Fig. 1A) and shoot fresh weight (g
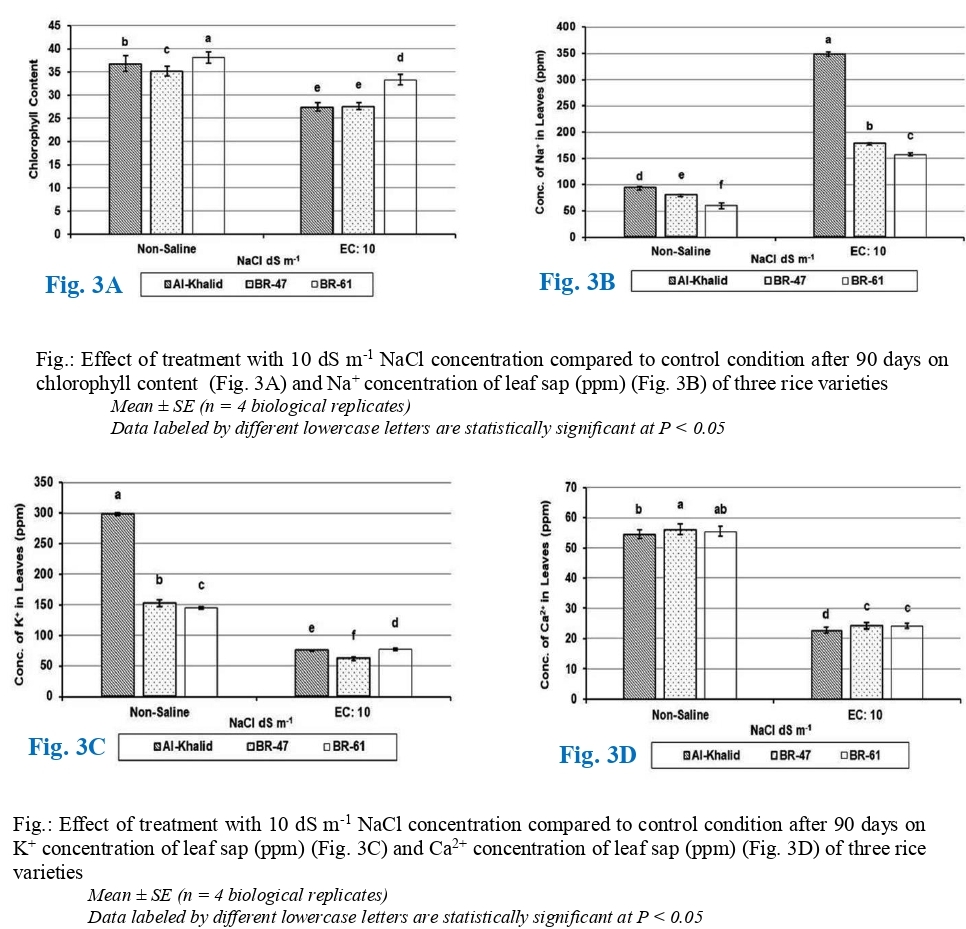
Fig.: Effect of treatment with 10 dS m-1 NaCl concentration compared to control condition after 90 days on chlorophyll content (Fig. 3A) and Na+ concentration o
Conclusion
It can be concluded from the above experiment that among the three rice varieties tested, BR-61 proved to be the most tolerant and a potential variety for cultivation in the saline areas, and it exhibited maximum SPAD values and expressed higher root-shoot fresh/dry weights and root-shoot lengths under 10 dS m-1 NaCl stress. Contrastingly, other varieties like; BR-47. Al-Khalid being on the local maturity group, exhibited moderate adaptability and represented lower values for all parameters as expressed to salinity stress, however it could be enhanced by further breeding exercises. The content is the key factor which clearly signifies the tolerant and sensitive varieties. Furthermore, the tolerant rice varieties effectively restricted the entry of Na+ into their leaves, however, efficiently maintained K+ concentration and vice versa. This implies that management and breeding of rice types should focus on improving on the salinity tolerance in order to reduce its effects on the yield of rice. Hence, future studies should be directed towards establishing the particular molecular; biochemical and physiological factors that give the tolerance to these varieties and which should lay the basis for the production of new varieties of rice that are salt-tolerant.
Acknowledgement
We are thankful to the Department of Soil and Environmental Sciences, MNS-University of Agriculture, Multan, Punjab Pakistan for providing all the facilities to conduct this research work.
Competing interests
The authors declare that they have no known competing financial interests or personal relationships that could have appeared to influence the work reported in this paper.
References
Ahmad, M. J., Arif, M., Iqbal, A., Khalid, M., & Akhtar, N. (2013). Rice production in salt-affected soils of Pakistan using different reclamation techniques. In S. A. Shahid et al. (Eds.), Developments in soil salinity assessment and reclamation: Innovative thinking and use of marginal soil and water resources in irrigated agriculture (pp. 283–293). Springer.
Ali, M. N., Ghosh, B., Gantait, S., & Chakraborty, S. (2014). Selection of rice genotypes for salinity tolerance through morpho-biochemical assessment. Rice Science, 21(5), 288–298. https://doi.org/10.1016/S1672-6308(13)60189-4
Ali, Y., Aslam, Z., Ashraf, M. Y., & Tahir, G. R. (2004). Effect of salinity on chlorophyll concentration, leaf area, yield and yield components of rice genotypes grown under saline environment. International Journal of Environmental Science and Technology, 1, 221–225. https://doi.org/10.1007/BF03325836
Aslam, M. (2016). Agricultural productivity current scenario, constraints and future prospects in Pakistan. Sarhad Journal of Agriculture, 32(4), 289–303. https://doi.org/10.17582/journal.sja/2016.32.4.289.303
Aykroyd, W. R., Gopalan, C., & Balasubramanian, S. C. (1963). The nutritive value of Indian foods and the planning of satisfactory diets (Special Report Series No. 42). Indian Council of Medical Research.
Chand, M., Abrol, I. P., & Bhumbla, D. R. (1978). A comparison of the effect of eight amendments on soil properties and crop growth in a highly sodic soil. Indian Journal of Agricultural Sciences, 47(7), 348–354.
Chawla, S., Jain, S., & Jain, V. (2012). Salinity induced oxidative stress and antioxidant system in salt-tolerant and salt-sensitive cultivars of rice (Oryza sativa L.). Journal of Plant Biochemistry and Biotechnology, 22, 27–34. https://doi.org/10.1007/s13562-012-0107-4
Chen, T. H. H., & Murata, N. (2002). Enhancement of tolerance of abiotic stress by metabolic engineering of betaines and other compatible solutes. Current Opinion in Plant Biology, 5(3), 250–257. https://doi.org/10.1016/S1369-5266(02)00255-8
Djanaguiraman, M., & Ramadass, R. (2004). Effect of salinity on chlorophyll content of rice genotypes. Agricultural Science Digest, 24(3), 178–181.
Garg, A. K., Kim, J. K., Owens, T. J., Ranwala, A. P., Choi, Y. D., Kochian, L. V., et al. (2002). Trehalose accumulation in rice plants confers high tolerance levels to different abiotic stresses. Proceedings of the National Academy of Sciences, USA. https://doi.org/10.1073/pnas.252637799
Gupta, B., & Huang, B. (2014). Mechanism of salinity tolerance in plants: Physiological, biochemical, and molecular characterization. International Journal of Genomics, 2014, 701596. https://doi.org/10.1155/2014/701596
Hakim, M. A., Juraimi, A. S., Hanafi, M. M., Ismail, M. R., Rafii, M. Y., Islam, M. M., et al. (2014). The effect of salinity on growth, ion accumulation and yield of rice varieties. Journal of Animal and Plant Sciences, 24(3).
Hasanuzzaman, M., Nahar, K., & Fujita, M. (2013). Plant response to salt stress and role of exogenous protectants to mitigate salt-induced damages. In P. Ahmad et al. (Eds.), Ecophysiology and responses of plants under salt stress (pp. 25–87). Springer.
Irum, A., & Ehetisham-ul-Haq, M. (2017). Phosphorous dynamics in salt-affected soils and its management. Agrihunt.
Jamil, M., Iqbal, W., Bangash, A., Rehman, S., Imran, Q. M., & Rha, E. S. (2010). Constitutive expression of OSC3H33, OSC3H50 and OSC3H37 genes in rice under salt stress. Pakistan Journal of Botany, 42(6), 4003–4009.
Khan, G. S. (1998). Soil salinity/sodicity status in Pakistan (Report No. 59). Soil Survey of Pakistan, Lahore.
Maas, E. V., & Hoffman, G. J. (1977). Crop salt tolerance—Current assessment. Journal of the Irrigation and Drainage Division, 103(2), 115–134. https://doi.org/10.1061/JRCEA4.0001137
Mittal, S., Kumari, N., & Sharma, V. (2012). Differential response of salt stress on Brassica juncea: Photosynthetic performance, pigment, proline, D1 and antioxidant enzymes. Plant Physiology and Biochemistry, 54, 17–26. https://doi.org/10.1016/j.plaphy.2012.02.003
Momayezi, M. R., Zaharah, A. R., Hanafi, M. M., & Razi, I. M. (2009). Agronomic characteristics and proline accumulation of Iranian rice genotypes at early seedling stage under sodium salts stress. Malaysian Journal of Soil Science, 13, 60.
Parvaiz, M. (2014). Response of maize to salt stress: A critical review. International Journal of Health Sciences, 1(1), 13–25.
Razzaq, A., Ali, A., Safdar, L. B., Zafar, M. M., Rui, Y., Shakeel, A., et al. (2019). Salt stress induces physiochemical alterations in rice grain composition and quality. Journal of Food Science, 85(1), 14–20. https://doi.org/10.1111/1750-3841.14983
Razzaque, M. A., Talukder, N. M., Islam, M. S., Bhadra, A. K., & Dutta, R. K. (2009). The effect of salinity on morphological characteristics of seven rice (Oryza sativa) genotypes differing in salt tolerance. Pakistan Journal of Biological Sciences, 12(5), 406–412. https://doi.org/10.3923/pjbs.2009.406.412
Reddy, I. N. B. L., Kim, B. K., Yoon, I. S., Kim, K. H., & Kwon, T. R. (2017). Salt tolerance in rice: Focus on mechanisms and approaches. Rice Science, 24(3), 123–144. https://doi.org/10.1016/j.rsci.2016.09.004
Sabagh, A. E., Hossain, A., Islam, M. S., Barutcular, C., Hussain, S., Hasanuzzaman, M., et al. (2019). Drought and salinity stresses in barley: Consequences and mitigation strategies. Australian Journal of Crop Science, 13(6), 810–820. https://search.informit.org/doi/10.3316/informit.580050100084352
Saeedpour, S. (2014). Effect of salinity on growth, chlorophyll content and ions uptake of rice cultivars (Oryza sativa). Applied Field Crops Research, 27(102), 2–11. https://doi.org/10.22092/aj.2014.100920
Sakina, A., Ahmed, I., Shahzad, A., Iqbal, M., & Asif, M. (2016). Genetic variation for salinity tolerance in Pakistani rice (Oryza sativa L.) germplasm. Journal of Agronomy and Crop Science, 202(1), 25–36. https://doi.org/10.1111/jac.12117
Shah, M. A. A., Özel, G., Chesneau, C., Mohsin, M., Jamal, F., & Bhatti, M. F. (2020). A statistical study of the determinants of rice crop production in Pakistan. Pakistan Journal of Agricultural Sciences, 33(1), 97–105.
Summart, J., Thanonkeo, P., Panichajakul, S., Prathepha, P., & McManus, M. T. (2010). Effect of salt stress on growth, inorganic ion and proline accumulation in Thai aromatic rice, Khao Dawk Mali 105, callus culture. African Journal of Biotechnology, 9(2).
Syed, A., Sarwar, G., Shah, S. H., & Muhammad, S. (2020). Soil salinity research in 21st century in Pakistan: Its impact on availability of plant nutrients, growth and yield of crops. Communications in Soil Science and Plant Analysis, 52(3), 1–18. https://doi.org/10.1080/00103624.2020.1854294
Taylor-Powell, E., & Steele, S. (1996). Analyzing qualitative data. University of Wisconsin-Extension, Program Development and Evaluation.
Veatch-Blohm, M. E. (2007). Principles of plant genetics and breeding. Crop Science, 47(4), 1763–1763.
Wahome, P. K., Jesch, H. H., & Grittner, I. (2001). Mechanisms of salt stress tolerance in two rose rootstocks: Rosa chinensis “Major” and R. rubiginosa. Scientia Horticulturae, 87(3), 207–216. https://doi.org/10.1016/S0304-4238(00)00168-0
Yeo, A. R., & Flowers, T. J. (1980). Salt tolerance in the halophyte Suaeda maritima L. Dum.: Evaluation of the effect of salinity upon growth. Journal of Experimental Botany, 31(4), 1171–1183. https://doi.org/10.1093/jxb/31.4.1171
Zeeshan, M., Lu, M., Sehar, S., Holford, P., & Wu, F. (2020). Comparison of biochemical, anatomical, morphological, and physiological responses to salinity stress in wheat and barley genotypes deferring in salinity tolerance. Agronomy, 10(1), 127. https://doi.org/10.3390/agronomy10010127
Zhao, X., Wang, W., Zhang, F., Deng, J., Li, Z., & Fu, B. (2014). Comparative metabolite profiling of two rice genotypes with contrasting salt stress tolerance at the seedling stage. PLoS ONE, 9(9), e108020. https://doi.org/10.1371/journal.pone.0108020
Copyright
Open Access This article is licensed under a Creative Commons Attribution 4.0 International License, which permits use, sharing, adaptation, distribution and reproduction in any medium or format, as long as you give appropriate credit to the original author(s) and the source, provide a link to the Creative Commons license, and indicate if changes were made. The images or other third party material in this article are included in the article’s Creative Commons license, unless indicated otherwise in a credit line to the material. If material is not included in the article’s Creative Commons license and your intended use is not permitted by statutory regulation or exceeds the permitted use, you will need to obtain permission directly from the copyright holder. To view a copy of this license, visit http://creativecommons.org/licenses/by/4.0/.

