Farmers perception and knowledge in the management of major pests of rice in Sierra Leone
Abstract
Pest infestation has been a major challenge for famers Sierra Leone, and this limited the production of rice thereby posing serious threat to food security issues in the country. Unfortunately, there is a limited study on farmers’ perception and knowledge on the identification and management of these pests. Therefore, a study was conducted to assess rice farmers’ perception and knowledge on the management of pests in Sierra Leone. The study was carried out in three major rice growing districts and employed a mixed-methods approach. The study targeted 300 farmers across three districts and data collected using structured questionnaire. Data were analyzed using Statistical packages for social science and both descriptive and inferential statistics were performed. The findings revealed that middle aged farmers were the most dominant and played a critical role in rice production while there was limited engagement from the younger and older farmers posing serious concern about further production. There were more male farmers indicating gender disparities and thus emphasizing the need for women inclusion in farming activities. The findings also revealed that farmers relied heavily on traditional pest control methods such as manual pest removal and farm sanitation which are not effective and less scabble. There was a low adoption of integrated pest management among farmers and lack of capital was seen as the most dominate constraints faced by farmers. The findings observed regional differences in yield loss and pest management practices. This study therefore underscores the importance of education, training, and financial support in promoting IPM adoption and sustainable pest management.
Introduction
Rice is the main staple crop in Sierra Leone and provides 80% of its caloric intake (Vangahun, 2019). Rice cultivation in Sierra Leone is primarily undertaken by smallholder farmers who produce barely enough for home consumption with little or none for the market across both upland and diverse lowland ecologies. The smallholder farmers in Sierra Leone are generally resource-poor with only the hoe, axe, and cutlass as the main implements, while labour is mainly supplied by family members, thereby severely limiting their scale of production (GOSL, 2018). According to FAO (2020), of the total global rice production of 499.6 million tonnes in 2020, SSA contributed about 3%. Of the rice produced in SSA, more than 80% was from eight countries (Nigeria, Madagascar, Ivory Coast, Tanzania, Mali, Guinea, Sierra Leone, and Senegal; with Nigeria and Madagascar accounting for one third of the rice production in the sub region (FAO, 2020). A steady increase in rice cultivation has occurred over the years, but not sufficient to meet basic requirement of demand, hence a deficit in the country’s rice supply chain. Consumption of rice, however, exceeds production in the country. Sierra Leone produces 712,092 metric tonnes of rice while it consumes 1,094 million metric tonnes of rice annually (USDA, 2018), moreover, the country has long struggled to meet its local rice consumption demands. In Sierra Leone, pest and disease attacks are among the major factors limiting the production and high yield in rice. However, little is known about pests’ management options and status of farmers' fields regarding yield loss caused by major rice diseases of Sierra Leone. This makes a study in this area very necessary because every successful breeding program should be based on distinct identification of farmers’ constraints and preferences of end users. Insect pests attack has become a major challenge limiting rice production couple with other challenging factors such as climate change, poor irrigation, poor soil fertility and diseases infection (Pokhrel, 2011). Pokhrel, 2011, also reported insects like Rice Gundhi bug (Leptocorisa acuta), Rice hispa (Dicladispa armigera), Mealybug (Ripersia oryzae), Plant hoppers (Nephotettix apicalis, Sogatella fercifera and Ceeadela spectra), Yellow stem borer, striped borer, and Armyworm (Mythimna seprata) to be found invasive in the rice field and are responsible for about 80% yield loss. As a result of the limited knowledge and subsistence nature of our rice faming system in Sierra Leone, insect pests’ damages have been fully recognized by farmers and absolute scarcity of rice have not been experienced this why farmers seem to be neglecting plant protection issues. Therefore, the aim of the study is to access farmer’s perception and knowledge on the identification and management of major insect pests of rice in three major rice growing regions of Sierra Leone.
Material and Methods
Description of the study area
This study assesses farmers' perceptions and conducts field assessments of major insect pests in three districts of Sierra Leone: Kambia, Kenema, and Moyamba, chosen for their diverse agro-ecological conditions and agricultural significance. Kambia, located in the northern part of Sierra Leone, is characterized by a tropical climate with wet and dry seasons. Kenema, in the Eastern Province, has a humid tropical climate favorable for rice, cocoa, oil palm, and vegetables. Rice cultivation is especially common in the lowland areas.
Research Design
The study utilized a non-experimental design that incorporated both quantitative and qualitative methods to ensure triangulation and establish the validity of the research findings. Qualitative methods were employed to examine social phenomena and understand their significance to the participants, while quantitative methods aimed to quantify and analysed variables using statistical methods.
Sampling population of research
The sampling population considered the population of farmers involved in rice production, and not farmers involved in other farming enterprises were not part of the study since the researcher wanted to have a manageable size of the research work and to satisfy the study objective. The population comprised both sexes with no exception to someone being disable or physically challenged.
Sampling technique and sample size of research
The study selected a sample size of 300 rice farmers from three districts that is 100 farmers randomly selected. The study employed both probability and non-probability sampling techniques. For the non-probability sampling, a purposive approach was used to select cassava farmers in selected chiefdoms of the seven districts. In the probability sampling method, a systematic sampling technique was used to select communities within the chosen chiefdoms. The communities were then clustered, with separate clusters for males and females. Samples were selected from each stratum using a simple random sampling procedure. There were about 7,800 farmers in the three districts according to Ministry of Agriculture and Food Security (MAFS), 2023 and to avoid bias in the determination of the actual sample size, Yamane (1973) mathematical model for selecting appropriate sample size was adopted. The model is expressed as;

Where n = required sample size
N = Total population of the study,
e = Error margin
1= Constant

n = 300
Data collection
The data collection procedure involved three components: two primary data collection methods and one secondary data collection method. Data was collected using a structured questionnaire administered to the sampled respondents by trained enumerators with Diploma and BSc degree qualifications. The interviews took place at the respondents' homes and lasted a maximum of 45 min. Enumerators explained the study's purpose and questionnaire content, ensuring respondents of data confidentiality. Verbal consent was obtained from participants before starting the interview, and they had the option to terminate the interview if they felt uncomfortable. During the interview, questions about insect pest’s encounters and management were repeated and clarified for accurate responses. Farmers' responses were read back to them for confirmation, and contact details were collected for potential follow-up during analysis. Farmers' reactions and knowledge of insect pests were assessed through the presentation of photos of some insect pests or infestations.
In addition to primary data, secondary information was collected from archived data sources such as the Ministry of Agriculture and Food Security (MAFS) and some Farmer-Based Organizations (FBOs) in the districts.
Ethical consideration of research
At the beginning of the data collection process, permission was sought from the relevant institution authorities who introduced the researcher and team to the rice farmers. Each questionnaire included an introductory letter requesting the respondents’ cooperation in providing the required information for the study. The farmers were assured that their information would be kept confidential and that the study findings are going to be used for academic purposes only. Rice farmers were assured of their personal protection and that they have the mandate of accepting or rejecting the interview.
Validity and reliability of research
The questionnaire underwent a process to ensure its validity and reliability. For validity, the instrument was developed under the supervision of research supervisors, considering both content and face validity protocols. Experts also provided feedback on the draft which was incorporated into the final questionnaire. Additionally, English and formatting were validated by individuals with knowledge and experience in the field. To ensure reliability, the instrument was pre-tested. Ten variables of the questionnaire were subjected to a Cronbach Alpha test using SPSS for reliability analysis. The results showed a reliability value of 0.75, indicating the consistency of the research instrument.
Data analysis
The survey data were entered into the SPSS 25 software for analysis. The analysis involved the use of descriptive and inferential statistics.
The preferences identified were ranked using numerals, following the Likert scale (1, 2, 3, 4... N), from the most preferred to the least preferred. The mean rank score for constraint was computed, with the factor receiving the lowest score considered the most preferred or highest constraint. Conversely, the factor with the highest score was ranked as the least preferred.
Determination of the degree of agreement among the respondents was done using a technique proposed by Kendall. The coefficient of concordance was estimated using the relation;
 …………………...…. (1)
Where: W = Kendall’s value; N = total sample size; R = mean of the rank; T = sum of rank of factors being ranked; m = number of respondents (farmers); n = number of factors being ranked; W = coefficient of concordance. The W was tested for significance in terms of the F distribution.
The F-ratio is given by
 ………………………. (2) With numerator and denominator degrees of freedom being
 and
and
 , respectively.
Results and Discussion
Socio-demographic and farming experience characteristics of rice famers across three regions in Sierra Leone
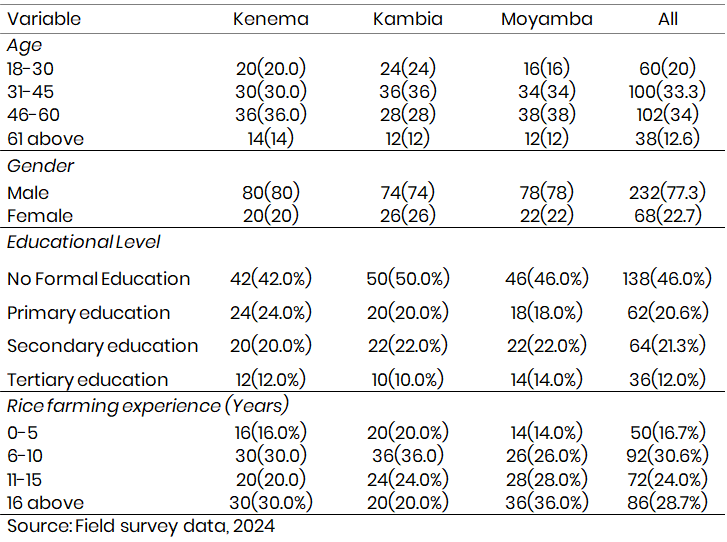
The results on the age distribution of rice farmers revealed that 202(67.3%) out 300 farmers interviewed were within range 31-60. This age group generally represents the most physically active and economically productive stage of life, indicating that rice farming in these districts is largely sustained by an active working-age population. Farmers within the old age group (above 61) accounted for only 12.6%(38) which suggest that there is future potential labor limitation in the study area because farmers in this age group might face physical constraints couple with health challenges which will eventually hinder their involvement in physical farming activities thus relying on younger family members to maintain their faming activities. The findings revealed that there were more male farmers accounting for 77.3% (232) and their female counterpart. The study indicates the dominance of male in rice farming further reflecting on the social and cultural norms that influence gender role in agricultural labor. The study also showed that most farmers 138(46.0%) do not have formal education and only 12.0% (36) of the farmers have tertiary education, few farmers 64(21.3%) have secondary and primary 62(20.6%) education. The high number of farmers with no formal education may pose serious limitation to them effectively understanding and adopted improved technologies that will increase yield and control pest. The distribution experience among respondents showed that a greater number 92(30.6%) of the respondents have 6-10 years’ experience in farming followed by farmers with 16 years and more experience 86(28.7%) which suggest that there is a mix of both relatively new and well experienced farmers with a diversity of perception and knowledge within the family community in the study area. Farmers with 6-10 years of experience may bring fresh ideas or a willingness to explore new farming practices, while those with 16 or more years possess accumulated local knowledge and skills that are invaluable in managing rice farming efficiently (Table 1).
Table 1: Socio-demographic and farming experience characteristics of rice famers across three regions in Sierra Leone
Knowledge and management of pests across three districts
A higher proportion of farmers from the Kambia (63.0%), Kenema (71.6%), and Moyamba (93.0%) districts have reported the occurrence or experience of pests in their rice farms (Table 2).
The key pests identified as infesting cassava farms included Birds (Ploceus philippinus), grass-cutter (Thryonomys swinderianus), stem borer (Scipophaga incertulas), rice ear bug (Alydidae), leaf hopper (Nephotettix virescens), and termites (Isoptera). Among these, Birds (82.6%) were perceived as the most troublesome pests by farmers in all the district followed by grass-cutter (63.3%). Other pests mentioned by farmers included stem borer, rice ear bug, leaf hopper and termite.
The distribution of farmers based on their awareness and willingness to implement IPM is presented in Fig. 1. Majority of the farmers (55.0%) were not aware of integrated pest management practice, while 45.0% of them reported that they are aware of IPM practices. However, a higher percentage of the farmers (78.5%) express their willingness to implement integrated pests management technologies, while only (21.5%) of the farmers insisted that they are not willing to implement such (Fig. 1).
Table 2: Farmers knowledge of rice pests across the three districts
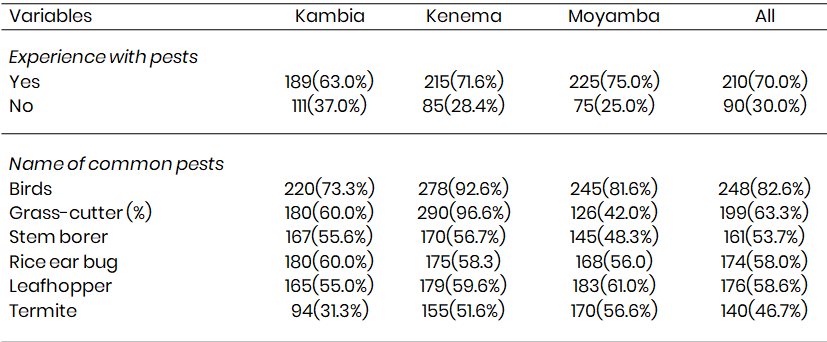

Fig. 1: Distribution of farmers based on their awareness and willingness to implement IPM
Findings on pests and diseases management strategies utilized by farmers are presented in Fig. 2. Most (45.3%) of the farmers relied on farm physical and cultural control practices, which involved manual picking of grasshoppers, setting traps, hunting, and constructing fences to protect their crops from animals like grass-cutters, squirrels, and cows. This method aims to maintain a clean environment and reduce the presence of pests. The second most important pest management technique utilized by 24.0% of the farmers was farm sanitation. This included regular weeding and brushing around the farm. Chemical pesticides were also used by 10.0% of the farmers to control pests on their farms. However, 20.2% of farmers employ no pest control measures on their farms, possibly due to limited resources, lack of awareness, or personal preferences. This indicates that extension services and training support for pest and disease management are inadequate.
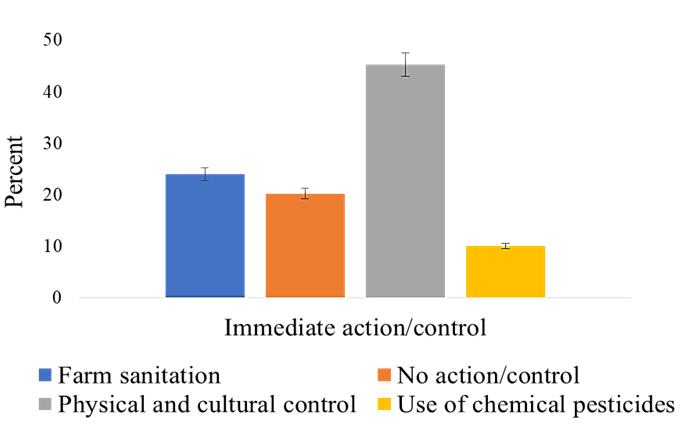
Fig. 2: Distribution of pest management strategies by farmers in the study area
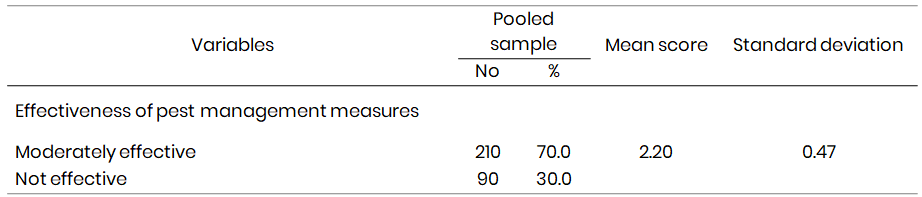
Rating of the level of pest management practice is presented in Table 3. Most farmers (70.0%) opined that their pest management practices were moderately effective compared to 30.0% of farmers who indicated that their pest management practices were not effective. The mean score for the level of effectiveness of farmers' pest management practices was 2.20, with a standard deviation of 0.47. This suggests that the overall level of effectiveness of the pest management strategies was perceived to be moderately effective.
Table 3: Rating of the level of pest and disease management practice
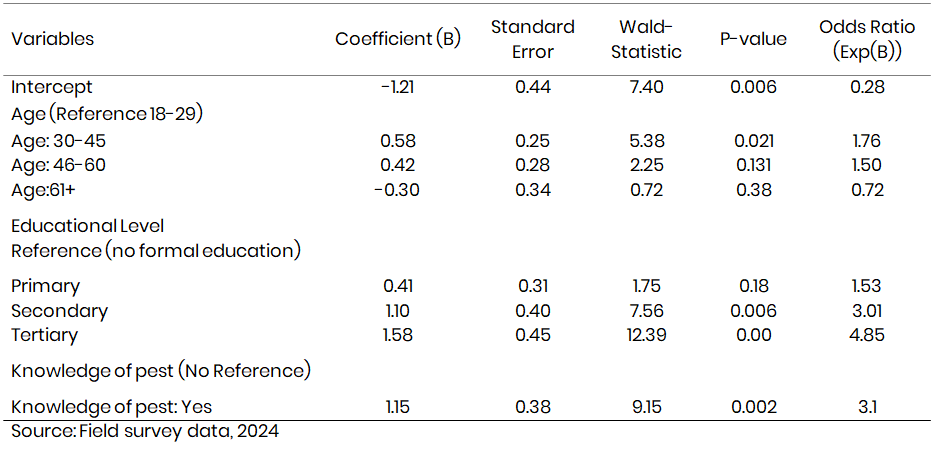
Analysis of factors influencing the adoption of Integrated Pest Management (IPM)
The logistic regression prediction model, on the factor influencing the adoption of integrated pests management by farmers with a coefficient of (B = -1.21 and a P-value (0.006) revealed a baseline likelihood of farmers adoption of IPM in the absence of demographic and knowledge factors with the odds ratio (OR= 0.28) which clearly reflect a low baseline probability indicating farmers are generally less in inclined towards adopting IPM with factors influencing them (Table 4). This underlines the role of additional predictors, particularly age, education, and pest knowledge, in positively influencing IPM adoption rates. The model revealed that farmers between the ages 30-45(odd ratio = 1.76, p-value-0.02) are significantly more likely to adopt IPM technologies than younger reference group (18-29). This might be because of more physical readiness and economic motivation that will serve as a catalyst for this age group (30-45) to embrace and implement new agricultural practices. The higher likelihood of adoption of IPM by farmers with this age group may indicate their increased exposure to agricultural innovations and a willingness to invest in sustainable practices like IPM. Farmers ages 46-60 years showed a positive but not significant association with IPM adoption (OR = 1.50,P= 0.131) which suggest that these farmers might be receptive to IPM but often face barriers or challenges such as limited access to resources which are needed for proper adoption. The model revealed that farmers within age group 61+ showed negative but not significant association with IPM (OR = 0.72,P = 0.38). The low adoption is because farmers within this age group might have resistance to change, have physical limitations and even lack motivation to engage in new agricultural endeavors or practice.
It was revealed from the finding that Education as a significant predictor of IPM adoption, with results indicating a clear trend. The model predicted that farmers with higher level of education have increased likelihood association with IPM adoption. Farmers with primary school education have weak positive but significant association with IPM adoption(OR = 1.53, P = 018) which suggest that even minimal formal education may encourage openness to adoption of IPM, potentially due to improved literacy and basic understanding of agricultural practices. It was also predicted that farmers with secondary school alone are significantly three times (OR = 3.0, P = 0.006) more likely to adopt IPM compared to those without formal education. This finding suggest that farmers with secondary education are equipped with critical thinking skills and more aware of sustainable Agricultural practice which enables to adopt IPM.
Knowledge of pests plays a crucial role in IPM adoption, as demonstrated by a strong and statistically significant positive association (OR = 3.1, P = 0.002). It was revealed from the findings that farmers with pests’ identification and management practice knowledge are three times more likely to adopt IPM compared to those that lack such knowledge. The findings suggest that understanding pest behavior and their control strategies can significantly impact farmers’ perception of IPM and hence increased greater acceptance of the integrated control strategies.
Table 4: Logistic Regression Analysis of Factors Influencing the Adoption of Integrated Pest Management (IPM)
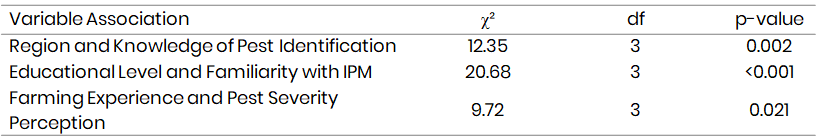
Association between key variables and IPM adoption indicators
The chi-square (χ²) tests result in Table 5 showed the association between specific demographic and experience-based variables and indicators relevant to IPM adoption. Significant (p = 0.002) association was observed between regions and pest identification knowledge which indicate geographical location influences farmers ability to identify pest species accurately. The variation at regional level in pest recognition among farmers can be attributed to differences in access to pest management resources, educational programs, or extension services across regions. It can be seen from the findings that a strong knowledge of pest identification can also be linked to high IPM adoption rate as farmers who can recognize pests are better positioned to make informed management decisions.
The level of farmers familiarity with IPM was highly significant (p < 0.001) which suggests that higher education perfectly correlates with greater awareness and familiarity with IPM practices. This significant association might be likely because of the ability of farmers to access education chances, understand, and apply agricultural innovations as familiarity with IPM is critical for adoption because it equips farmers with the skills and knowledge to assess the benefit of the technology over the conventional. The association between farming experience and farmers’ perception with regards pests’ severity was significant (p = 0.02) as predicted by the model which suggest that time spent on agricultural practices can influence their view of pest impacts. The model explained that more experienced farmers may have developed more awareness of pests associated risk due to the prolonged exposure to pest management challenges.
Table 5: Association between key variables and IPM adoption indicators
Perceived causes of pest problems
This factor represents farmers' beliefs about the environmental and operational causes contributing to pest problems (Table 6). The findings revealed high loadings for pest control (0.70) followed by weather changes (0.62) but low loadings (0.43) for poor soil health as farmers environmental factors contributing to pest problem which indicate pest control and weather changes are strongly perceived by farmers as a catalyst for pest problem. Farmers do not perceive poor soil health as a major driving force that fosters pests’ problems which indicate farmers in the study are not concerned about soil health and consequently even soil fertility which pose serious problems for good yield irrespective of problem. During the study it was observed farmers often attribute pests’ problems to limited proper pest control measures changing weather patterns such as increased temperatures or unpredictable rainfall that can foster pest proliferation similarly, though with low loadings, few farmers perceived that poor soil health might lead to weakened crop resilience hence making them vulnerable to pests.
Findings on operational causes to the pest problem revealed that lack of financial support and training programs have high loadings (0.84 and 0.78) respectively. The findings clearly indicate that farmers consider structured training and financial aid for more efficient management of pests as training programs are essential for equipping farmers with up-to-date IPM techniques, while financial support can help in accessing necessary resources for implementation.
Highly loadings (0.69) were observed for lack of access to IPM resources as one of the contributing factors for the pest problem emphasizing the importance of the availability of resources necessary for effective IPM implementation. Farmers who can readily access IPM inputs, such as bio pesticides or pest-resistant crop varieties, are more likely to adopt these sustainable practices.
Table 6: Factor analysis of perceived influences on IPM adoption

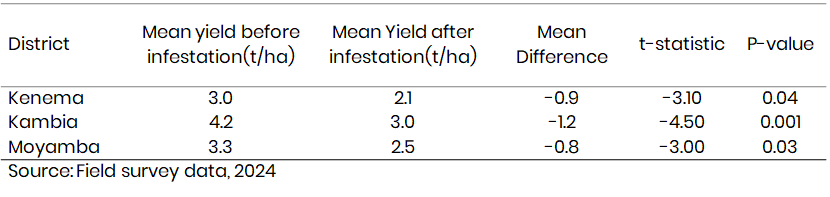
Impact of insect pest infestation on rice yields
The findings found out that pest infestation across the three studies significantly result in yield reduction as it was reported by farmers. In each district, negative mean yield (t ha-1) was revealed indicating reduction as result of post-infestation. The yield loss was relatively similar between Kenema and Moyamba district with Kenema district having a yield recording yield of 0.9 t ha-1 and Moyamba district with yield loss of 0.8 t ha-1 but was different from Kambia where the higher of 1.2 t ha-1 was observed. The t-statistics and p-values confirm the significance of these reductions. For instance, Kenema shows a t-statistic of -4.50 with a p-value of 0.001, which indicates that there is a substantial difference between yields before and after infestation, similar trends were also observed for the Kenema and Moyamba districts (Table 7).
Table 7: Impact of Pest Infestation on Rice Yields in Three Districts
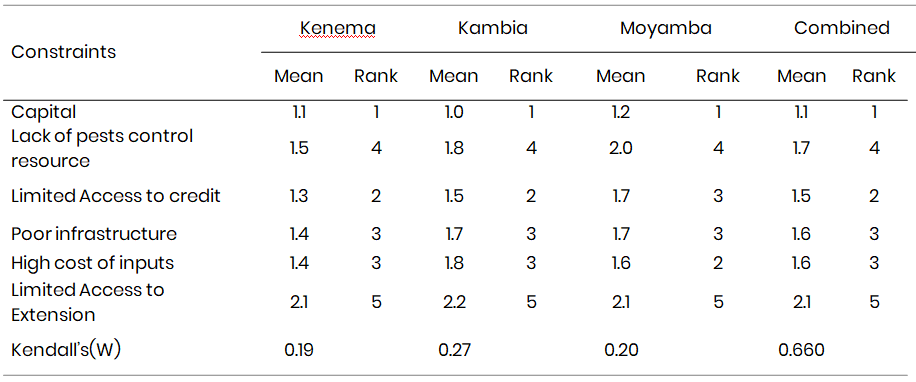
Constraints on rice production
Rice production constraints were classified into six categories to identify major production constraints faced by farmers. These constraints were ranked to identify the most important constraints to the least important ones. Findings from the survey research revealed that lack of capital was the most important constraint faced by farmers (Table 8). This was followed by limited access to credit facilities, Limited Access to Extension was ranked as the least important constraint. There was a higher level (66.0%) of agreement among the farmers across the study locations on the ranking of these constraints (Kendall’s W = 0.660). There was an agreement among farmers in all three districts, Kenema (19.0%), Kambia (27.0%) and Moyamba (20.0%) that lack of capital was the most important constraints faced by rice farmers in all region’s region (Kendall’s W = 0.19 , 0.27 and 0.20, respectively). Limited Access to credit was ranked as the second most important constraints in Kenema (19.0%) and Kambia (27.0%), High cost of inputs was ranted the second most important constraints in Moyamba (0.20%). However, Limited Access to Extension was ranked the least important constraints faced by rice farmers in all the three districts (Kenema, Kambia and Moyamba).
Table 8: Farmers production constraints in three districts of four regions of Sierra Leone
Discussion
The findings of this research revealed critical insight into the socio demographic characteristics of rice farmers, pest management practice and factors that influence the adoption of integrated pests’ management by farmers. The middle-aged group farmers were predominant in the study area which suggested that they serve as a backbone for rice farming the area, although there was low presentation of older-aged group farmers, but this raises serious concerns about labor shortage and knowledge transfer due to limited mechanization (FAO, 2020). Male farmers dominated the farming system in the study area suggesting gender disparities which reflect socio-cultural norms but empowering women through training and incentive could significantly enhance productivity and food security (Doss et al., 2018). Integrated pest management was strongly influenced by education, with literacy enhancing farmers’ ability to understand and implement sustainable practice (World Bank, 2021; Feder et al., 2004). Experience also correlates with pest risk awareness which indicates that supporting the role of prolonged exposure in improving decision-making (Asfaw et al., 2015). Traditional pest control methods, such as manual removal and farm sanitation, remain common but are labor-intensive and lack scalability. The limited adoption of chemical pesticides reflects resources constraints and limited extension support while the prevalence of unmanaged pests increases crop vulnerability (Abate et al., 2020).
The findings observed significant yield loss in all the study districts because of pests’ infestation with Kambia district suffering the highest yield loss which indicates regional disparity in pests’ management knowledge, and this further highlights the need for a tailored extension service. The operation constraint of which financial support (loadings, 0.84) and limited training access (0.78), underscore the importance of resource availability and structured outreach to improve IPM adoption (Abate et al., 2020). Addressing barriers through education, financial aid, and gender-inclusive policies can foster sustainable agricultural practices and mitigate yield losses effectively.
Conclusion
The study sheds light on the socio-demographic characteristics of rice farmers, their pest management practices and the determinant of adopting integrated pest’ management technologies. The study concluded that there were more middle-aged male farmers indicating their critical role in agricultural productivity, suggesting the need for gender inclusivity and the importance of education in fostering innovation. It was further concluded from the findings that traditional pests control methods were the most prevalent, whilst there was a limited adoption of IPM technologies indicating that there are gaps in the availability of resources, awareness to ward off the management of pests and even extension services. The study also concluded that addressing these challenges requires targeted policies, enhanced training and the community-driven initiative, which will promote sustainable practice and thus ensure the long-term resilience and productivity of the farming system.
References
Abate, T., Van Huis, A., & Ampofo, J. K. O. (2000). Pest management strategies in traditional agriculture: An African perspective. Annual Review of Entomology, 45(1), 631-659.
Asfaw, S., Di Battista, F., & Lipper, L. (2015). Agricultural technology adoption under climate change in Africa: Micro-evidence from Niger. Journal of African Economies, 25(5), 637-669.
Doss, C., Meinzen-Dick, R., Quisumbing, A., & Theis, S. (2018). Women in agriculture: Four myths. Global Food Security, 16, 69-74.
Feder, G., Murgai, R. & Quizon, J. B. (2004). The acquisition and diffusion of knowledge: The case of pest management training in farmer field schools, Indonesia. Journal of Agricultural Economics, 55(2), 221-243.
Food and Agriculture Organization (FAO). (2020). Global and regional rice production trends: Sub-Saharan Africa's contribution. Economic Research Service. Retrieved from Economic Research Service
Copyright
Open Access This article is licensed under a Creative Commons Attribution 4.0 International License, which permits use, sharing, adaptation, distribution and reproduction in any medium or format, as long as you give appropriate credit to the original author(s) and the source, provide a link to the Creative Commons license, and indicate if changes were made. The images or other third party material in this article are included in the article’s Creative Commons license, unless indicated otherwise in a credit line to the material. If material is not included in the article’s Creative Commons license and your intended use is not permitted by statutory regulation or exceeds the permitted use, you will need to obtain permission directly from the copyright holder. To view a copy of this license, visit http://creativecommons.org/licenses/by/4.0/

