Characterization and micronutrient content of soils of similar lithology under different Land Use Types in Aboh-Mbaise, Imo State, Nigeria
Abstract
This study was conducted to evaluate the physicochemical properties and micronutrient content of soils under selected land use types in Mbaise, Imo State. Three land use types namely fallow land, cassava cultivation and oil palm plantation were used for the study. The surface samples 0 -30 were collected. A total of nine samples were collected from the three land use types. Result showed that mean sand content ranged from 708.4 – 729.6 g kg-1, mean silt content ranged from 28.4 – 47.2 g kg-1 and mean clay content ranged from 223.2 – 262.9 g kg-1. Mean bulk density ranged from 1.39 – 1.46 Mgm-3. Mean moisture content ranged from 20.69 – 23.30 % while mean total porosity ranged from 44.82 – 48.87 %. There was significant difference in silt content, clay content, bulk density, total porosity and moisture content among the soils of the studied land use types. The mean pH (water) ranged from 5.48 - 6.02. Average organic carbon ranged from 5.9 – 9.1 g kg-1. Average total nitrogen varied from 0.74 – 1.08 g kg-1. Mean available phosphorus ranged from 38.97 – 95.07 mg kg-1. Average calcium-magnesium ratio varied from 0.18 -1.17. Mean total exchangeable bases (TEB) varied from 3.03 -9.00 cmol kg-1. Mean effective cation exchange capacity (ECEC) varied from 5.08 – 10.25 cmol kg-1 while mean carbon-nitrogen ratio varied from 6.53 – 11.57. There was significant difference in soil chemical properties among the soils of the studied land use types with the exception of total nitrogen, calcium, potassium, sodium and total exchangeable acidity. Micronutrient of the soils showed that Average copper (Cu) ranged from 0.106 – 0.173 mg kg-1, mean manganese (Mn) 1.66 -3.30 mg kg-1, mean iron (Fe) ranged from 1.94 -2.63 mg kg-1 and mean zinc (Zn) ranged from 0.063 – 0.108 mg kg-1. There was significant difference in manganese content among the soils of the studied land use types. There was a significant positive correlation between organic carbon and moisture content, clay, total nitrogen, available phosphorus, ECEC, Cu, Mn and Zn (r = 0.34, 0.49, 0.56, 0.48, 0.35, 0.50, 0.32 and 0.44 p≤ 0.05) respectively.
Introduction
Land use has been categorized into major kind as rain-fed agriculture, grassland, fish pond, forestry, grazing and tourism and into primary or compound kinds in which more than one kind of land use is practiced (FAO, 2002). Land use affects soil fertility and productivity. These manifests as changes in soil properties such as nutrient content (N, P, K, Ca, Mg, and S etc), pH, organic matter, ECEC, soil structure (Akamigbo and Asadu, 2001). The main problem associated with inappropriate land use changes are land degradation and soil quality deterioration through loss of vegetative cover, top soil moisture, infiltration capacity, water storage, soil organic matter, fertility resilience, natural regeneration capacity and a lower water table in which these factors are critical for soil health. Agricultural sustainability needs a periodic evaluation of soil fertility status. This is imperative in understanding factors which cause serious constraints to increase crop production under different land use and for adoption of suitable land management practices. Information so generated could also be useful in adjusting present land use types or in the development of appropriate land use policy for a given area. This is particularly important in south-eastern Nigeria, where demographic factors, poor land management and inherent low soil fertility (Enwezor et al., 1990) under different land uses often result to poor crop yield.
Essential micronutrients are not usually applied to the soil through common fertilizers, yet about two to six times in quantity of these micronutrients are removed annually from the soil than is applied (Lawal et al., 2012). The practice of fertilizer application in Nigeria in general and southeast in particular is in favour of nitrogen (N), phosphorus (P), and potassium. (K). The increase in the use of NPK fertilizers lacking in micronutrients has no doubt increased crop production, but it brought with it a host of other problems associated to micronutrient deficiencies (Ahukaemere et al., 2014). In order to get the full potentials of soils, it is imperative to take the inventory of their nutrient status which includes the essential micronutrients.
The study is aimed at determining the inherent characteristics of the soils under different land use in the studied area as this will help to know the level of soil fertility of the area under study.
Material and Methods
The study was conducted at Aboh Mbaise, Imo state. It lies between latitudes 5° 27' N and 7° 14' E. Soils of the area are formed from coastal plain sands. It is a lowland area with humid tropical climate having a rainfall of over 2500 mm and mean annual temperature of 26–29 ℃. Tree plants such as palm tree, raffia palms, and other cash crops dominate the vegetation popularly referred to as the rainforest belt of Nigeria (Onwudike, 2010). Farming is a dominant socio-economic activity of the study area (Onwudike et al., 2015). Farmers still stick to traditional slash – and – burn system of clearing and soil fertility regeneration is by natural bush fallow where soils are allowed to regain their lost nutrients without intentional input from farmers (Onweremadu, 2007). Reconnaissance field survey of the area was carried out. Representative soil sampling sites were selected based on vegetation and cultivation history. The representative land use was selected (fallow land, cassava cultivated land and oil palm plantation). From each land use three surface soil samples were collected from the depth of 0–30 cm using a soil auger (Wildings, 1985). The soil samples collected were air dried, sieved using 2 mm sieve prior to analysis. The laboratory analysis of the soils studied was carried out and the following parameters were determined, Soil particles size distribution was determined by the Bouyoucos hydrometer method (Bouyoucos, 1962; Van Reeuwijk, 1992). Bulk density was determined using the core method (Grossmans and Reinsch, 2002). Total porosity was computed from the values of bulk density and particle density (Brady and Weil, 2002) as
Tp= (1-pb/ps) × 100/1 ----------1
Where Tp = total porosity, pb = bulk density, ps = particle density assumed to be 2.65 g cm-1 for tropical soils. Moisture content was determined by Gravimetric method (Obi, 1990). It was computed as follows;
%MC= (W2 -W3)/(W3 - W1 )× 100/1 --------2
W1 = Weight of moisture can
W2 = Weight of air-dried soil + moisture can
W3 = Weight of oven-dry soil + moisture can
Soil pH was determined in water at a ratio of 1:1 (soil: liquid ratio) using a glass electrode (Van Reeuwijk, 1992). Organic carbon was determined by wet oxidation method as described by (Walkley and Black, 1934). Organic matter was then determined by multiplying the organic carbon with a value of 1.724 (Van bemmmelen factor). Total nitrogen was determined using the micro kjeldahl method as described by (Black, 1965). Available phosphorus was determined by Olsen method as described by (Emteryd, 1989). An exchangeable base was determined by extraction using 1N NH4OAC neutral solution (Thomas, 1982), exchangeable calcium and magnesium in the extract were analyzed using atomic absorption spectrophotometer while sodium and potassium were analyzed by flame photometer (Chapman, 1965: Rowell, 1994). Exchangeable acidity was determined by leaching the soil sample with potassium chloride solution and titrating with sodium hydroxide as described by (Mclean, 1982). Base saturation was determined by summation. The effective cation exchange capacity (ECEC) was determined by the addition of all the exchangeable acidity and exchangeable bases.
ECEC = Exchangeable acidity + Exchangeable bases. Base saturation was determined by calculation using the formulae
%BS =TEB/ECEC ×100/1 ----------3
The available micronutrients (Cu, Mn, Fe and Zn) were extracted with 0.1 N HCl and determined by the use of Atomic Absorption Spectrophotometer (AAS).
Data analysis.
The experiment was replicated three times. Descriptive statistical tool was used in analyzing collected data. Analysis of variance (ANOVA) at p = 0.05 probability level was used to determine variation among soil data and mean separated using least significant difference (LSD). Correlation analysis was used to determine relationship between soil properties.
Results and Discussion
Soil physical properties of the studied land use types
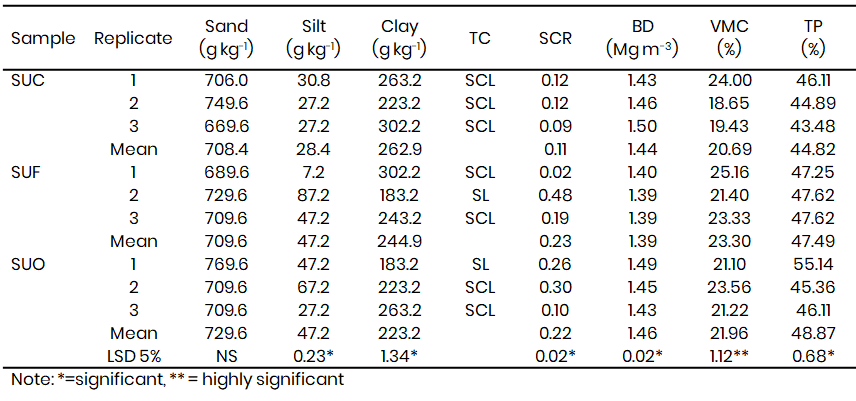
The results of the physical properties of the studied soils are shown in Table 1. Cassava cultivated soil (SUC), the mean textural distribution was 708.4 g kg-1, 28.4 g kg-1 and 269.6 g kg-1 for sand, silt and clay respectively. Soil under fallow land (SUF), the mean textural fraction was 709.6 g kg-1, 47.2 g kg-1 and 249.4 g kg-1 for sand, silt and clay respectively, while soil under oil palm plantation (SUO), the textural fraction was 729.6 g kg-1, 47.2 g kg-1 and 223.2 g kg-1 for sand, silt and clay respectively. The textural class ranged from sandy loam to sandy clay loam. The sand fraction is higher than the other fractions in all the soils however, the sand fraction is not significant in all the soils. This is attributed to the parent material from which the soils are formed which is coastal plain sands (Enwezor et al., 1990). However, there was significant difference in the silt and clay fractions. It therefore implies that such soils have high infiltration capacity which usually leads to detachment, erosion and leaching of essential nutrients. This generally creates an avenue for infertility of the soils. The mean silt/clay ratio are soil under cassava 0.11, soil under fallow 0.23 while soil under oil palm 0.22. The highest was recorded on soil under fallow and the lowest on soil under cassava. The low silt/ clay ratio is an indication that there is advanced stage of weathering in the soils. According to Eshett, (1990) soils with low silt/clay ratio show high weathering in the soils. In tropical soils, silt and silt/clay ratio is being used to evaluate the degree of weathering and low silt or silt/clay ratio is being recognized as indicators of advanced weathering (Stewart et al., 1970). The bulk density varied from 1.43 - 150 Mg m-3 for soils under cassava cultivation, 1.39 -140 Mg m-3 for soil under fallow land and 1.43 – 1.49 Mg m-3 for soil under oil palm plantation. The highest mean bulk density occurred in soil under oil palm plantation (1.46 Mg m-3) while the lowest mean bulk density occurred under fallow land (1.39 Mg m-3). There was significant difference in bulk density among the soils. The result followed the order soil under oil palm > soil under cassava > soil under fallow. Soils with low bulk density can increase root penetration, soil aeration and nutrient uptake. Therefore crops grown on soil under fallow will have easy root penetration, adequate aeration and will be able to take up water and other nutrients than the other land use types. This can be attributed to the fact that soil under fallow land has high organic carbon when compared to the other land uses. However, values of the bulk densities were above the critical limit of 1.3 Mgm-3 recommended for tuber and cereal crops (Kayombo and Lal, 1984). This result is contrary to Onwudike et al. (2016) who reported bulk density of below 1.3 Mg m-3 for soils under palm plantation, cassava farm land and fallow land in the area. Total porosity of the soils ranged from 43.48 – 46.11 % for soil under cassava, 47.25 – 47.62 % for soil under fallow and 25.36 – 55.14 % for soil under oil palm. There was significant difference in total porosity among the soils. The highest porosity occurred on soil under oil palm and the lowest on soil under cassava. This finding agrees with Onwudike et al. (2016) who stated that highest and lowest total porosity were recorded by oil palm and cassava respectively in soils of Mbaise, Imo State, Southeastern, Nigeria.
Table 1: Physical properties of studied soils
Chemical properties of the studied land use types
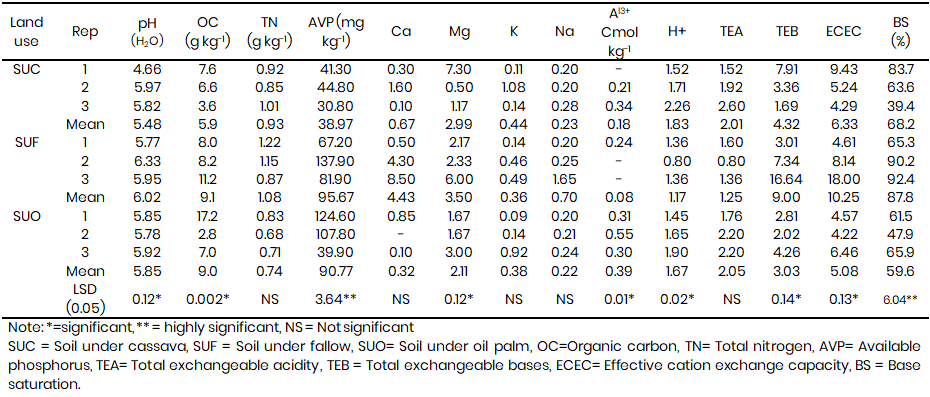
The result of chemical properties of the studied soils under different land use types are presented in Table 2. The mean pH (water) for all the land use types ranged from 5.48–6.02. The highest was recorded in soil under fallow while the lowest was recorded in soil under cassava. The soils of the various land use types were moderately acidic. This result agrees with Onwudike et al. (2015), Onwudike et al. (2016) and Mbah, (2006) who obtained similar result in the region. The highest soil pH in fallow land could be as a result of litter falls which through its decomposition increases soil organic matter and exchangeable bases in the process reducing the accumulation of hydrogen and aluminium ions on soil exchange complex (Onwudike, 2010). The acidic nature of these soils could be due to the excessive rainfall of the area which leads to leaching away of nutrients or eroding away of essential nutrients for crop growth. When basic cations are leached away, they are replaced with hydrogen and aluminium ions which lead to an increase in the pH of the soil. Crop grown on such soils may not do well due to high Al3+ content in the soil. This result agrees with Nkwopara et al. (2022) on eroded and non eroded soils of Urualla, Imo State. An increase in the base saturation of the soil improves the nutrient content of the soil thereby reducing acidity (Enwezor et al., 1990). The mean soil organic carbon ranged from 5.9–9.1 g kg-1. Onwudike et al. (2015) observed the range of 5.4 – 13.2 g kg-1 in selected land use types in the area. The highest soil organic carbon was observed in the fallow land (9.1 g kg-1), followed by oil palm plantation (9.0 g kg-1) and the least was 5.9 g kg-1 in cassava cultivated land. This finding is in agreement with Onwudike et al. (2016) who observed similar result in the area. The highest organic carbon recorded in the fallow land could be attributable to the presence of litter and leaf drop from surrounding canopies that has undergone decomposition and also protecting the soil surface from rainfall impact and also expected increase in soil biodiversity Miller and Gardiner, (2001). Woldeamlak and Stroosnijder (2003) observed that conversion of forest vegetation to agricultural land leads to decline of the soil organic carbon content. This could be the reason for the low content of organic carbon observed in cassava cultivated land compared to the other land use types. The mean total nitrogen ranged from 0.74 to 1.08 g kg-1. The highest value of (1.08 g kg-1) was observed in soil under fallow and the lowest value of (0.74 g kg-1) was recorded on soil under oil palm plantation. Fallow land recorded the highest mean available phosphorus of (95.67 mg kg-1) and the least (38.97 mg kg-1) was in cassava cultivated land. The high total nitrogen and available phosphorus observed in fallow land could be attributed to litter fall and higher soil organism that help in the decomposition of organic matter since organic matter and nitrogen have a positive correlation (Onwudike, 2010).
High available phosphorus in the fallow land could be attributed to high soil pH values and soil organic carbon which reduces phosphorus fixation in the soil (Mbah, 2006). The mean exchangeable cations were low in the three land use types with the highest values recorded in fallow with the exception of potassium. Exchangeable Ca, Mg, K and Na in fallow land were 4.43, 3.50, 0.36 and 0.70 cmol kg-1 respectively. In cassava cultivated land the values were 0.67, 2.99, 0.44 and 0.23 cmol kg-1 respectively while in oil palm plantation the values were 0.32, 2.11, 0.38, and 0.22 cmol kg-1 respectively. The low exchangeable bases in these soils could be attributed to high rainfall which leads to accelerated runoff and leaching down the subsoil. Higher exchangeable bases in soil under fallow land could be as a result of the macro and micro climate that hinder the impact of rain drops on this soil (Brady and Weil, 2002). On the exchangeable Al and H, fallow lands recorded the lowest values of mean exchangeable Al and H with values 0.08 and 1.17 cmol kg-1 respectively. In cassava cultivated land the values were 0.18 and 1.83 cmol kg-1 respectively. While in oil palm plantation the values were 0.39 and 1.67 cmol kg-1 respectively. Lower values of exchangeable Al and H in fallow land could be due to high soil pH , organic carbon and vegetation cover that reduces run off of plant nutrients thereby reducing accumulation of Al and H ions on exchange complex (Brady and Weil, 2002) .This findings agree with Onwudike et al. (2016) who recorded similar result in the area. Fallow land recorded the lowest value of mean total exchangeable acidity of 1.25 cmol kg-1 while the highest value of 2.05 cmol kg-1 was recorded in oil palm plantation. Fallow land recorded the mean highest total exchangeable bases (TEB), Effective cation exchange capacity (ECEC) and base saturation (BS) of 9.00 cmol kg-1, 10.25 cmol kg-1 and 82.63 % respectively and the lowest was on oil palm plantation with values 3.03 cmol kg-1, 5.08 cmol kg-1 and 58.43 % respectively. High TEB, ECEC and BS in fallow land could be as a result of increase in exchangeable bases and organic carbon obtained from mineralization of litter falls in fallow land.
Table 2: Chemical properties of the studied land use types
Selected elemental ratio of the studied land use types
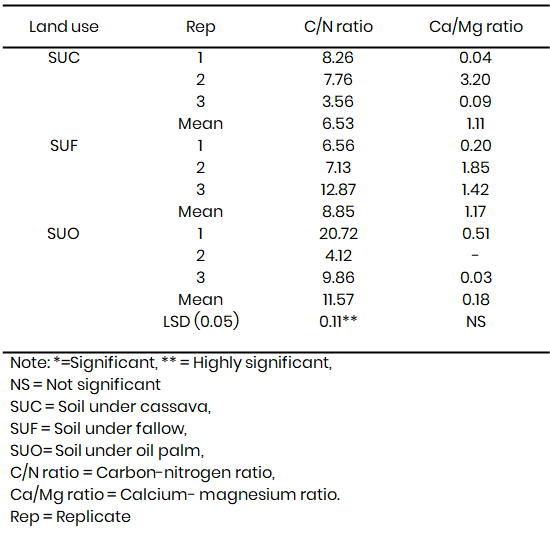
The result of selected elemental ratio of the studied soils under different land use types are presented in Table 3. The mean carbon-nitrogen ratio (C/N) ranged from 6.53 - 11.57. The highest occurred in soil under oil palm plantation while the lowest occurred in soil under cassava cultivation. Nkwopara et al. (2019) observed the range of 10.17 – 10.44 in selected eroded and non-eroded sites in the region. Carbon-nitrogen ratio of soil less than 24 leads to net mineralization of nitrogen while carbon-nitrogen ratio of soils greater than 24 leads to net immobilization of nitrogen (USDA-NRCS, 2011). This shows that there is net mineralization of nitrogen in the soils of the various land use types. Secondly, according to Hazelton and Murphy, (2007), C/N values lower than 25 as observed in the present study indicated that decomposition proceeds at a maximum rate possible under hot conditions which is characteristic of the environment of the study. Average calcium-magnesium (Ca:Mg) ratio ranged from 0.18–0.23. The highest occurred in soil under cassava cultivation while the lowest occurred in soil under fallow. Nkwopara et al. (2021) observed the range of 1.20 – 1.78 in oil palm, plantain and cassava land uses in the region. Ca:Mg values lower than 3:1 are characteristics of unfertile soils (Landon, 1991).
Considering the values recorded in the soils of the land use types, they are low in fertility. The low Ca:Mg ratio indicates possible Ca deficiency and phosphorus inhibition (Udo et al., 2009).
Table 3: Selected elemental ratio of the studied land use types
Micronutrients content of studied land use types
The results of the micronutrients content of the soils are shown in Fig 1. The mean available copper (Cu) content ranged from 0.106–0.173 mg kg-1. The highest was observed in soil under oil palm while the lowest occurred in soil under fallow. The values of copper obtained in this study were low compared to the critical value of 2.0 mg kg-1 reported by Sim and Johnson (1991). Generally, available Cu obtained in this study was low when compared with the value reported by Lawal et al. (2012); Adeboye, (2011) in hydromorphic soils of Nigeria but within the range reported by Ahukaemere et al. (2014) in paddy soils of Abia state, southeastern Nigeria. The mean available manganese (Mn) of the soils varied between 1.66 and 3.30 mg kg-1. The highest value of (3.30 mg kg-1) was recorded in oil palm while the lowest (1.66 mg kg-1) was obtained in fallow land. There was significant difference in manganese content of the various land use types. The values of manganese obtained in the study were high compared to the critical value of 1.00 mg/kg reported by Udo et al. (2008). With this result, all the soils are therefore regarded as having adequate available Mn. Similar findings have been reported by Ahukaemere et al. (2014) on paddy soils of Abia state, southeastern, Nigeria. High availability of manganese in these soils may be attributed to pH, clay and organic matter content of the soils. The mean available iron (Fe) content of the soils ranged from 1.94 – 2.63 mg kg-1. The highest value of (2.63 mg kg-1) occurred in soil under oil palm while the lowest value of (1.94 mg kg-1) was obtained under cassava cultivation. No significant difference was observed in the iron content of the soils of the different land use types studied. The values of Fe obtained in this study were low compared to the critical value of 4.5 mg kg-1 reported by Lindsay and Norvell (1978). This result is contrary to result by Ahukaemere et al. (2014) who reported values of iron higher than the critical value of 4.5 mg kg-1 on paddy soils of Abia state, Southeastern, Nigeria. The mean available zinc (Zn) content of the soils ranged from 0.063 – 0.108 mg kg-1. The highest value of (0.108 mg kg-1) was obtained in fallow land while the lowest value of (0.063 mg kg-1) was observed under cassava cultivation. The values of available zn obtained in this study was below the critical level of 0.8 mg kg-1 reported by Lindsay and Norvell (1978) and 0.5 mg kg-1 reported by Udo et al. (2008). The zinc contents of the studied soils were rated low and are not adequate for crop production. This result is contrary to Ahukaemere et al. (2014) on paddy soils of Abia state, southeastern Nigeria.

Fig. 1. Available micronutrients of studied land use types
Relationship between organic carbon and selected properties of the studied soils
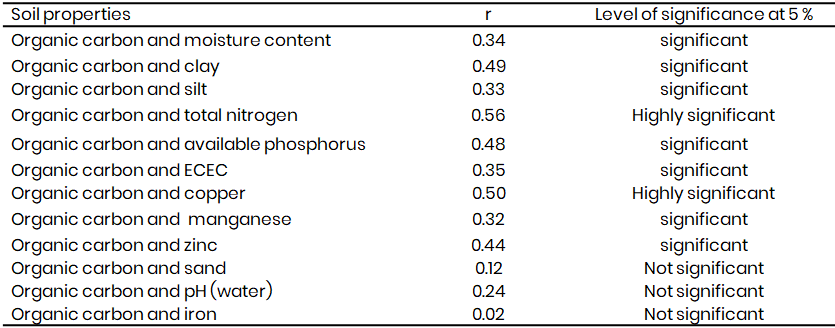
The relationship between organic carbon and soil properties are shown in Table 4. Result showed that there was significant positive correlation between organic carbon and moisture content, clay silt, total nitrogen, available phosphorus, effective cation exchange capacity, copper, manganese and zinc (r = 0.34, 0.49, 0.33, 0.56, 0.48, 0.35, 0.50, 0.32 and 0.44 ≤0.05 respectively. While organic carbon had a non significant positive relation with sand, pH (water), and iron (r = 0.12, 0.24 and 0.02 p≤0.05) respectively. This implies that increase in organic carbon will result to increase in these properties of the soil.
Table 4: Simple correlation of organic carbon with selected soil properties (n=9)
Conclusion
Land use types affected the physicochemical properties as there were significant difference in the properties of the soils studied with the exception of sand content, total nitrogen, calcium, sodium, calcium-magnesium ratio and total acidity. Available micronutrients were higher in soils under oil palm plantation with the exception of zinc content. With the exception of Mn, all the other micronutrients are low and had no significant difference with land use types. However, for optimum crop production, the soils require fertilizers that contain micronutrients while intensive cropping in the soils after a few years without organic and inorganic fertilizer that is enrich with manganese may apparently lead to mn-deficiency.
Acknowledgments
My immense appreciation goes to Mr. Simeon Nti of Soil Science and Technology Laboratory, Federal University of Technology, Owerri for his assistance during the laboratory analysis. Also Miss Jacinta Akujobi assistance in the course of this research is acknowledged.
References
Adeboye, M. K. A. (2011). Status of available boron and zinc in the soils of the Gongola River basins of Nigeria. Savanna Journal of Agriculture, 7(1), 130–136.
Ahukaemere, C. M., Nkwopara, U. N., & Ekpenyong, O. S. (2014). Profile distribution of selected essential micronutrients in paddy soils of Abia State, Southeastern Nigeria. Nigerian Journal of Soil Science, 24(1), 158–165.
Akamigbo, F. O. R., & Asadu, C. L. A. (2001). The influence of parent materials on the soils of Southeastern Nigeria. East African Agricultural and Forestry Journal, 48, 81–91.
Black, C. A. (1965). Methods of soil analysis: Part 1. American Society of Agronomy, Madison, WI, USA.
Bouyoucos, G. J. (1962). Hydrometer method improvement for making particle size analysis of soils. Agronomy Journal, 54, 179–186.
Brady, N. C., & Weil, R. R. (2002). The nature and properties of soils (13th ed.). Prentice-Hall Inc., New Jersey, USA.
Chapman, H. D. (1965). Cation exchange capacity. In C. A. Black, L. E. Ensminger, & F. E. Clark (Eds.), Methods of soil analysis (Agronomy No. 9, pp. 891–901). American Society of Agronomy, Madison, WI.
Emteryd, O. (1989). Chemical and physical analysis of inorganic nutrients in plant, soil, water and air. Stencil No. Uppsala, Swedish University of Agricultural Science.
Enwezor, W. O., Ohiri, A. C., Opuwaribo, E. E., & Udo, E. J. (1990). Literature review on soil fertility investigations in Nigeria. Federal Ministry of Agriculture and Natural Resources, Lagos.
Eshett, E. T. (1990). Properties, taxonomy, classification and improved management proposals of selected catenary soils on coastal plain sands of Southeastern Nigeria. Beiträge zur Tropischen Landwirtschaft und Veterinärmedizin, 28(1), 5–17.
Copyright
Open Access: This article is licensed under a Creative Commons Attribution 4.0 International License, which permits use, sharing, adaptation, distribution and reproduction in any medium or format, as long as you give appropriate credit to the original author(s) and the source, provide a link to the Creative Commons license, and indicate if changes were made. The images or other third party material in this article are included in the article’s Creative Commons license, unless indicated otherwise in a credit line to the material. If material is not included in the article’s Creative Commons license and your intended use is not permitted by statutory regulation or exceeds the permitted use, you will need to obtain permission directly from the copyright holder. To view a copy of this license, visit http://creativecommons.org/licenses/by/4.0/.

