Abstract
Field experiment was conducted in 2021/2022 cropping system at Debre Markos University Research and Demonstration site. The study area was selected based on wheat production potentials and hot spot for the occurrences of yellow rust on wheat. The study was aimed at investigating the correlation between yellow rust (Puccinia striiformis f. sp tritici) disease parameters, and yield components of bread wheat (Triticum aestivum L.). The experiment consisted of five wheat varieties (Kakaba, Honqolo, Liben, Lemu, and Wane) and three fungicides (Tilt (25 EC), Natura (250 EW) and Takeoff (293 SC)) including unsprayed fungicide plot (control) were used as treatment. It was conducted by using randomized complete block design with three replications in factorial arrangement. The result of Pearson correlation coefficient indicated that yellow rust (Puccinia striiformis f. sp tritici) disease parameters (severity, area under disease progress curve and incidence had positive and strong relationships among them but negatively and strongly related with yield components including thousand seed weight, test weight, biomass, yield and harvesting index of bread wheat. While there was strong and positive correlation among agronomical parameters except between harvesting index and biomass. Totally there was negative and high significant relationship between yellow rust disease and Agronomical parameters.
Introduction
Wheat is belongs to the Poaceae family, tribe Triticeae and it is one of the most important cereals crops in the world, with an area of cultivation that is larger than any other cereal crop and a large quantity of grain produced (Kumari et al., 2020). This grain is an important industrial and food crop and ranks second among the most important cereal crops in the world. It is the top cereal grain and used by more than one third of the world's population as a staple food. It grew at a wider range from 1500 to 3000 meters above sea level (Belete et al., 2018). The most suitable agricultural-economic zones for wheat production range from 1900 to 2700 m.a.s.l (Weiner et al., 2017). The total production volume of wheat is 772.64 million metric tons on more than 240 million ha in the world (FAO, 2021).
Wheat is used in the production of traditional and modern processed foods, such as injera, bread and other industrial products like pasta and macaroni (Tidiane et al., 2019). Moreover, wheat straw is commonly used as a roof tacking material and as a feed for animals. Wheat grains are good source of minerals, fibers, protein and antioxidants which recommended for health purpose (Gemechu et al., 2019).
The major wheat-producing countries in the world are China, India, the USA, Russia, France, Canada, Germany, Pakistan, and Australia (Tanaka et al., 2015). Wheat producing countries in Sub-Saharan Africa are Egypt, Ethiopia, South Africa, Sudan, Kenya, Tanzania, Nigeria, Zimbabwe, and Zambia in descending order (Tadesse et al.,2020). As FAO (2021) indicated. Ethiopia is one of the largest wheat producers subsequently to Egypt in Sub Sahara Africa in terms of total wheat area cultivated and total production (Abebele et al, 2020). The national production volume of wheat is 2.83 million metric tons (CSA, 2020/2021). In spite of the production and yield increases, average grain yield of wheat is still low (< 1.68 t/ha) highly variable and below the world’s average (3.54 t/ha). It ranks third in area coverage after teff and maize and second in terms of grain production next to maize (Anteneh and Dagninet, 2020).
Despite its importance as food and industrial crop, wheat production and productivity around the globe is hampered by a number of factors including biotic and abiotic stresses as well as low adoption of new agricultural technologies. Of the biotic stresses, diseases caused by fungi are the most important factors constraining wheat production. Septoria diseases (Septoria tritici blotch), stem rust (P. graminis f. sp tritici), leaf rust (P. triticina) and Yellow rust (Puccinia striiformis f. sp. tritici) are prevalent throughout the country (Figueroa et al., 2018).
Yellow rust disease is the most sever and destructive disease that cause reduction of wheat yield production and becoming more occurring often in midland and highland altitudes of Ethiopia (Alemu and Fininsa, 2016). However, the correlation between yellow rust disease and yield components of bread wheat have not been analyzed in the study area. So the objective of this study is to determine the relationship between yellow rust disease and yield components of bread wheat.
Material and Methods
Field experiment was conducted at major wheat growing area at Debre Markos University research site, in East Gojjam Zone, Ethiopia in the main cropping season in 2021. It far away 265 Km from Bahirdar and 304 Km from Addis Ababa. The area was selected based on wheat production potentials and hot spot for the occurrences of yellow rust on wheat. Debre Markos University is geographically located at 10° 19 ̍ 43 ̎ latitude North and 37° 44̍ 43 ̎ longitude East, with an altitude of 2,446 m.a.s.l.
The minimum and maximum temperatures are 11 °C and 25 °C, respectively. Annual average rainfall was 1,628 mm during 2021. The soil of the experimental area was dominated by Nitosols with a PH value of 5.6 (moderately acidic) (Fig. 1).
Treatments and Experimental Design
Five wheat varieties (Kakaba, Honqolo, Liben, Lemu, and Wane) and three fungicides (Tilt (25 EC), Natura (250 EW) and Takeoff (293 SC) including unsprayed (control) were used in the experiment. The experiment was done by using randomized complete block design with three replications in factorial arrangement and the treatments were assigned randomly to the experimental plots of a block. The size of the experimental plot was 1.6 m × 2 m (3.2 m2) consisting of eight rows with six harvested rows. The space between rows, plots and blocks were 0.2 m, 1.5 m and 2 m, respectively. Seeds of each wheat variety were sown at a rate of 150 kg ha−1 on a well-prepared plots and seeds were sown manually (hand drill) in rows.
NPSB (nitrogen, phosphorus, sulfur, boron) called Blended fertilizer and Urea fertilizers were applied at the rate of 200 kg ha-1 and 322 kg ha-1 respectively. The total amount of NPSB (Blended) fertilizer was applied during sowing and Urea was applied by split application (1/3 of urea fertilizer were applied at the time of seed sowing and the remains 2/3 of urea was applied after 35 days of seed sowing).
Data collected
Data were recorded on plot and single plant basis in which plot basis data were taken from the central four rows.
Disease data
Disease severity data was recorded by visually observations of the proportion of infected plant part according to Modified Cobbs scale, (1948) (Mahmoud et al., 2015). Severity data was taken starting from the appearance of the sign or symptoms to physiological maturity of the crop on 15 randomly selected pre-tagged plants in the central six rows of each plot. Each plant with in each plot was visually evaluated for percent foliar infection (severity) at 7 days interval as soon as the occurrence of disease symptom.
|
Disease severity = |
Area of plant tissue infected |
× 100 |
|
Total area of the plant part examined |
Area under disease progress curve calculated using the coefficient of infection values from the first rust severity data by using the subsequent formula (Campbell and Madden, 1990).

Where: Xi and Xi+1 are the values of two consecutive severity assessments, and ti and ti+1 are the dates of the two consecutive assessments. The measurement unit of AUDPC is (%-day).
In addition to this disease incidence data was also recorded on each experimental plot by counting number of diseased plants from 30 randomly taken plants of six rows and calculated at the proportion of the diseased plants over the total stand count (30 plants) at 105 days after seed sown and calculated using the formula suggested by (Campbell and Madden, 1990).
|
Disease incidence (%) = |
Number of infected plant |
× 100 |
|
Total number of plant |
Agronomic data
Thousand Seed Weight (TSW): The weight of thousand seeds was determined by carefully using a seed counter, adjusting to 12.5% moisture content and weighting them using sensitive balance and its weight expressed in grams.
Test Weight: The test weight of the grain was determined in kg/hectoliter (Kg/hl) following the American Association of Cereals Chemists, 1983 procedure and the moisture content was adjusted at 12.5% (Schuler et al., 1995).
Biomass and Grain Yield: grain yield in gram per plot at 12.5% moisture content was recorded and translated to t/ha. Only six of the internal rows of the plots were harvested for yield and biomass estimations, excluding 0.5 m on both sides along the length of the plot, and the net plot area was 1.4 m2.
Harvesting Index: It is ratio of grain yield to the total above ground biomass was determined by using the formula suggested by (Kemanian et al., 2007).
|
HI (%) = |
Grain yield |
× 100 |
|
Above ground biomass |
HI = Harvesting index
Data analysis
The data on disease severity was converted to area under disease progress curves (AUDPC), mean value of disease incidence, disease severity and yield components were subjected to GLM analysis of variance (ANOVA) to evaluate treatments effect using SAS computer package version 9.2 (SAS Institute Inc., 2008 version). Means for different fungicides and varieties combinations were compared using Fisher’s list significant different at 5% (LSD 5 %). Correlation analysis was performed using PROC CORR procedure of the SAS computer package to determine the relationship between disease and yield parameters (Rodriguez, 2011).
Results and Discussion
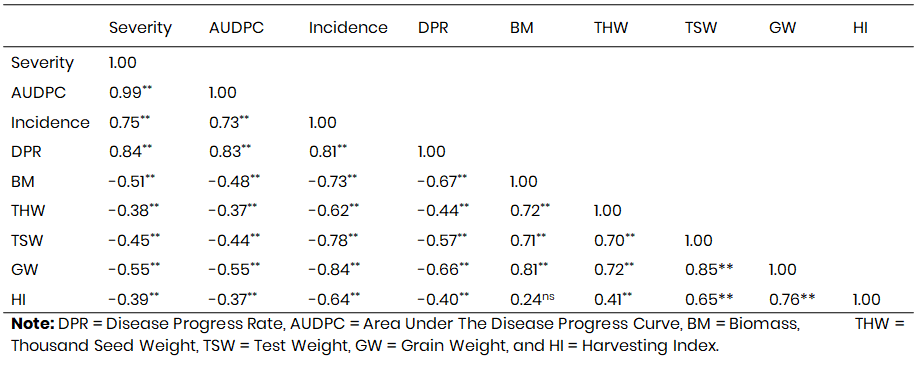
Correlation analysis among wheat disease and yield parameters was described in (Table 1). Disease severity, AUDPC and Disease incidence were positively associated, while they were negatively associated with biomass, thousand seed weight, test weight, grain yield and harvesting index. Area under the disease progress was positively correlated with disease severity (r = 0.99), yellow rust incidence correlated significantly and positively with yellow rust severity (r = 0.75) and Area under the disease progress curve (r = 0.73). Area under the disease progress curve (r = 0.83) and yellow rust incidence (r = 0.81). This correlation supported by Mabrouk et al. (2020) stated that, there was positive correlation between disease parameters and losses of grain yield and yield components of wheat.
Biomass of wheat was correlated with disease severity (r = - 0.51, Area under disease progress curve (r = - 0.48), and disease incidence (r = - 0.73), On the other hand thousand seed weight was positively and significantly correlated with biomass (r = 0.72), but negatively correlated with disease severity (r= - 0.38), Area under disease progress curve (r = - 0.37), and disease incidence (r = - 0.62). Also test weight of wheat was significantly correlated with biomass (r = 0.70) and thousand seed weight(r = 0.71), while it was negatively correlated with disease severity (r = - 0.45), area under disease progress curve (r = - 0.44), and disease incidence (r = - 0.78).
Nevertheless grain yield of wheat was highly and positively correlated with biomass (r = 0.81), thousand seed height (r = 0.72), test weight (r = 0.85), but it was negatively correlated with disease severity (r = - 0.55), area under disease progress curve (r = - 0.55), and disease incidence (r = -0.84). Mengesha, (2020), who stated that biomass, thousand seed weight, test weight and grain yield were positively correlated with each other, while negatively correlated with disease incidence severity, and AUDPC. Beyene, (2019), said that biomass positively correlated with grain yield and negatively correlated with severity, incidence and area under disease progress curve. However harvesting index was positively correlated with, thousand seed weight (r = 0.41), test weight (r = 0.65) and grain weight (r = 0.76), in which it was negatively correlated with disease severity (r = - 0.39), Area under the disease progress curve (r = - 0.37), and disease incidence (r = - 0.64) but non-significantly correlated with biomass. Based on this result it was concluded that the disease parameters were interrelated to each other, the presence of one has positive effluence on the other parameters. The correlation among disease parameters and parameters of yield and yield components of wheat were negatively related. Means, the level and infection of the disease (yellow rust) increased; the yield and yield components of wheat were reduced. Mengesha, (2020); Nigus et al. (2022), reported that yield and yield components of wheat reduced through severe infection of yellow rust at full growing stage of the crop, which progressively slayed the leaves and stems, and affected the normal physiological functions of the crop.
Table 1: Correlations coefficient (r) of disease parameters of yellow rust, and yield components of bread wheat d
Conclusion
In general, plant biomass, thousand seed weight, test weight, grain weight and harvesting index have positive correlation among them but negatively and strongly correlated with disease incidence, severity, progress rate and area under disease progress curve. Implies that yellow rust disease highly and negatively affected the yield and yield components of bread wheat, while it is not managed by using fungicides and disease resistance bread wheat varieties.
References
Abebele Getnet Muche, Merkuz Abera Admasu and Bekele Hundie Agdu. (2020). Field Evaluation of Bread Wheat (Triticum aestivum L.) Genotypes for Stripe Rust (Puccinia striiformis W.) Resistance in Arsi Highlands of Oromia Region, South-Eastern-Ethiopia. Journal of Plant Pathology and Microbiology, 11, 521.
Alemu, W., & Fininsa, C. (2016). Effects of environment on wheat varieties Yellow Rust resistance, yield and yield related traits in South-Eastern Ethiopia. Plant, 4(3), 14-22. Science publishing group
Anteneh Adugnaw & Dagninet Asrat. (2020). Wheat production and marketing in Ethiopia: Review study. Cogent Food and Agriculture, 6(1), 10-35.
Belete, Fresew, Nigussie Dechassa, Adamu Molla & Tamado Tana. (2018). Effect of nitrogen fertilizer rates on grain yield and nitrogen uptake and use efficiency of bread wheat (Triticum aestivum L.) varieties on the Vertisols of central highlands of Ethiopia. Agriculture and Food Security, 7(1), 1-12.
Beyene, N. (2019). Efficacy Evaluation of Different Foliar Fungicides for the Management of Wheat Strip Rust (Puccinia striiformis) in West Shoa Zone, Oromia, Ethiopia, (pp. 1-30).
Copyright
Open Access This article is licensed under a Creative Commons Attribution 4.0 International License, which permits use, sharing, adaptation, distribution and reproduction in any medium or format, as long as you give appropriate credit to the original author(s) and the source, provide a link to the Creative Commons license, and indicate if changes were made. The images or other third party material in this article are included in the article’s Creative Commons license, unless indicated otherwise in a credit line to the material. If material is not included in the article’s Creative Commons license and your intended use is not permitted by statutory regulation or exceeds the permitted use, you will need to obtain permission directly from the copyright holder. To view a copy of this license, visit http://creativecommons.org/licenses/by/4.0/

