Multivariate analysis and multi-trait index based selection of Maize (Zea mays L.) inbreds for agromorphological and yield components
Abstract
Germplasm is pivotal in breeding, significantly impacting targeted efforts through genetic diversity. Assessing genetic parameters aids researchers in precise germplasm selection for enhanced gains. Ideotype-based breeding refines this by tailoring plant types to specific goals. The Multi Trait Genotype Ideotype Distance Index (MGIDI) defines ideotype parameters and aids in selecting genotypes closely aligned with desired traits. A study conducted at Tamil Nadu Agricultural University during 2022-23 utilized 55 maize germplasm lines in a randomized block design, evaluating nine biometrical traits. Analysis of Variance revealed significant genotype differences for all traits, with grain yield positively associated with plant height, cob length, cob diameter, kernel row number, and kernels per row. Principal component analysis identified three PC with eigen value >1 explaining 74.44% cumulative variance, associating the first component with yield and cob traits, the second with flowering traits, and the third PC with shelling percentage and plant height. Two ideotypes based on maturity i.e. medium and late maturity were defined and MGIDI was calculated. Selection gains were positive for all the traits, and Genotype B. NO 1265-6-2 (G8) was ranked as the closest to the medium maturing ideotype. Similarly, Genotype UMI 1003-2-3 (G10) was closest in resemblance to the late maturing ideotype and the selection gains were positive for all the traits except plant height. This study emphasizes the critical role of germplasm selection and ideotype-based breeding in enhancing genetic gains in maize breeding programs.
Introduction
Maize, often known as corn, is a key grain crop in the Poaceae family that has enormous worldwide agricultural relevance (Shikha et al., 2021). Its origin may be traced back to the Tehuacan Valley in Mexico, where it was first domesticated. Maize has a genome size ranging from 2.4 to 2.7 gigabase pairs (Gbp) and is notable for being one of the first plant genomes of gigabase size to be sequenced using novel approaches such as omics technology (Rabinowicz and Bennetzen, 2006). This crop is critical for producing food, animal feed, and low-cholesterol edible oil for human and cattle use. Its domestication required considerable morphological changes, allowing the plant to adapt from its tropical origins to survive in a variety of environmental situations (Gálvez, 2020).
Maize agriculture in India covers around 10 million hectares, yielding 34.3 million metric tonnes and contributing just 2% to world production in the 2022-2023 timeframe (US-NAAS, 2023). Accurately estimating and projecting grain output is critical for guaranteeing food security and developing effective food policy (Ren et al., 2023). Understanding the relationship between yield and its constituent parts is essential for increasing agricultural productivity through strategic breeding (Datta et al., 2023). To precisely gauge the level of genetic diversity within a population, genotypic coefficients of variation (GCV), phenotypic coefficients of variation (PCV), broad-sense heritability (h2b), and genetic advance (GA) must be meticulously measured. Efficient selection methods rely on a parent population with a high degree of diversity. Metrics such as PCV and GCV give information on the amount of variation in a population, whereas heritability represents the proportion of a trait that is passed down to future generations (Adhikari et al., 2018). Understanding heritability helps guide selection approaches, forecast improvements, and evaluate the significance of genetic influences (Hadi and Hassan, 2021). The level of development observed in a certain characteristic under specific selection forces is measured by genetic advance. Higher genetic progress combined with enhanced heritability gives ideal circumstances for selection operations.
Grain yield in maize is a complex quantitative trait; hence direct selection for this trait is not fruitful. The correlation analysis points to the interrelationships between the yield and other traits taken under study. The information on these interrelationships can be utilized to structure a selection strategy to improve the yield through the selection of yield associated traits (Pavlov et al., 2015). The Principal Component Analysis (PCA) is a dimensionality reduction technique which is useful for inferring or identifying the patterns amongst the germplasm and the traits responsible for the variation (Guei et al., 2005). It can be used for genetic improvement of important traits contributing to the variability (Das et al., 2017).
An Ideotype can be defined as a plant type that has a combination of all the ideal traits (Rocha et al., 2018). The complexity of the selection of a superior genotype with all the favourable traits can be attributed to the quantitative nature of inheritance of those traits. Several selection indices have been proposed for selecting superior genotypes based on the defined selection criteria (Céron-Rojas and Crossa, 2018). The limitation of these indices is the effective conversion of the economic value of these traits into weightage for selection of genotypes. This roadblock was overcome by (Olivoto and Nardino, 2020) through the development of a multi trait selection index called the Multi Trait Genotype Ideotype Distance Index (MGIDI) which is based on factorial analysis. This index assigns weightage to the individual traits according to the breeding goal and aids in selection of superior genotypes. The MGIDI index has been used by multiple researchers for selection of superior genotypes in barley (Pour-Aboughadareh et al., 2021), oats (Klein et al., 2023), sesame (Ahsan et al., 2024) and maize (Singamsetti et al., 2023).
The current study aims to estimate the genetic variability present in the maize germplasm, mine the trait associations through correlation analysis and selection of superior genotypes by defining ideotypes with differential maturity i.e. Late and medium maturity with high yield and employ the MGIDI index to select superior genotypes which are close to the defined ideotype.
Material and Methods
Experimental material and layout
A total of 55 germplasm lines were obtained from the maize unit, Department of Millets, Tamil Nadu Agricultural University, Coimbatore to carry out the research study. The experiment was performed in a Randomised Block Design with three replications during Rabi 2022-23 in the experimental farm of the Department of Millets. Throughout the crop season, standard agronomic procedures and plant protection practices were implemented. To carry out the current investigation, the biometrical observation on Days to 50% tasseling, Days to 50% silking, Plant height (cm), Cob length (cm), Cob diameter (cm), Number of kernel rows, Number of kernels/row, Shelling percentage (%), and Grain yield (g) were recorded in selected five plants per genotype.
Statistical Analysis
For each of the traits studied, an analysis of variance was performed. Burton and De Vane's (Burton and Devane, 1953) formula was used to calculate the coefficient of variation for these qualities. This variance was then categorised as high (more than 20%), moderate (10% - 20%), or low (less than 10%). The broad sense heritability and the projected genetic advance (GA) was calculated using (Johnson et al., 1955) method and categorized as low, moderate, or high. Correlation analysis was carried out according to the methods described by (Miller et al., 1958). Principal Component Analysis, a dimension reduction approach developed by (Massey, 1965; Jolliffe, 1986) was used to compress variables while keeping important information. PCA was critical in decreasing data dimensionality and gaining insights from the dataset. The Multi-trait Ideotype Genotype Distance Index (MGIDI) distance index, established by (Olivoto and Nardino, 2020), was used to find genotypes that were closely related to the suggested ideotype. This ideotype is especially designed for early and late maturity periods, with the goal of producing a high yield. As a result, three ideotype reference models representing early, middle, and late maturity were developed. These reference models were used to identify genotypes that closely matched the target ideotype's attributes. To begin, each characteristic (rXij) was rescaled using the following equation (Eqn. 1)
where and
are the original minimum and maximum values for the trait j, respectively;
and
are the new minimum and maximum values for trait j after rescaling, respectively; and
is the original value for jth trait of the ith genotype. The values for
and
are chosen as follows: for the traits in which positive gains are desired,
= 0 and
= 100 should be used, while for the traits in which negative gains are desired,
= 100 and
= 0 should be used (Olivoto and Nardino, 2020). Subsequently, a factor analysis (FA) was carried out to facilitate the reduction of data dimensionality and to explore the underlying relationship structure. This analysis adhered to the following model (Eqn. 2)
Where, F is a g × f matrix with the factorial score; Z is a g × p matrix with the rescaled means; A is a p × f matrix of canonical loading, and R is a p × p correlation matrix between the traits. Furthermore, g, f, and p indicates the number of genotypes, factor retained, and measured traits, respectively. In the third step, a [1 × p] vector was considered as the ideotype matrix. The MGIDI index was then calculated by calculating the Euclidean distance between the genotype scores and the ideal genotype values. The following equation (Eqn. 3) was used to achieve this calculation:
Where, MGIDIi is the multi-trait genotype-ideotype distance index for the ith genotype; Fij is the score of the ith genotype in the jth factor (i = 1, 2, ..., g; j = 1, 2, ..., f), being g and f the number of genotypes and factors, respectively, and Fj is the jth score of the ideotype. The genotype with the lowest MGIDI is then closer to the ideotype and therefore should presents desired values for all the analyzed traits.
GRAPES, an R-based programme created by (Gopinath et al., 2020), was used for the ANOVA and genetic variability parameters analysis. The "metan" package inside the R programme, (Olivoto and Lúcio, 2020), was used for Correlation analysis and MGIDI calculations. Furthermore, Principal Component Analysis (PCA) was performed with a mix of tools and packages. GRAPES was used in conjunction with the programmes ggplot2 (Wickham, 2016), corrplot (Wei and Simko, 2021), and factoextra (Kassambara and Mundt, 2020). These packages, used together, aided in the implementation of the PCA.
Results
Per se performance of the genotypes
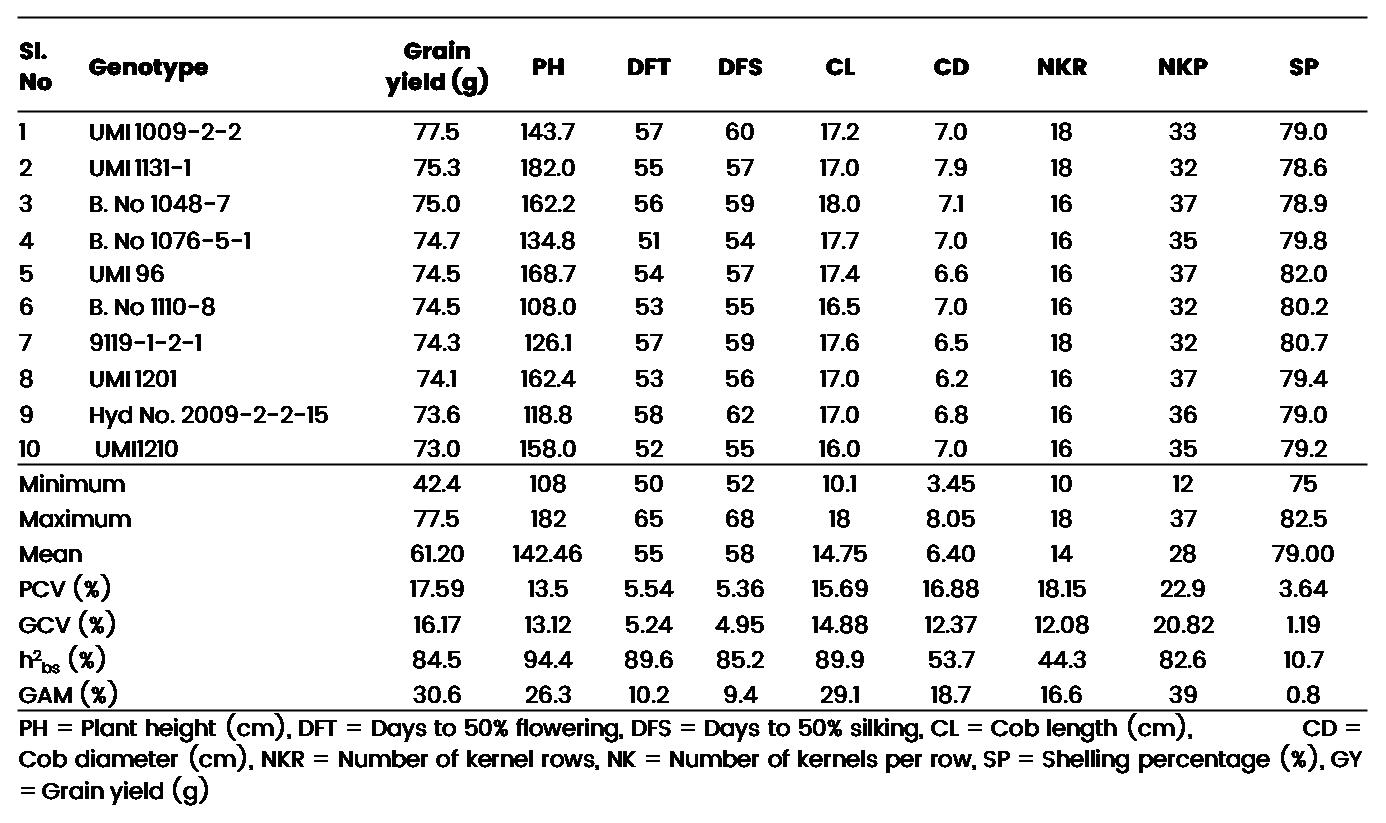
Analysis of variance showed the presence of significant difference between all the traits indicating the presence of ample genetic variation for further exploitation (Supplementary Table 1). The per se performance (Table 2) for the observed traits in the experiment revealed the following trends. Plant height ranged between 108 to 182 cm with a mean of 142.46 cm. while days to 50% tasseling ranged between 50 to 65 days categorizing the germplasm into medium and late duration types, while the days to 50% silking ranged between 52 to 68 days. The cob length ranged between 10.0 to 18.0 cm with an average length of 14.7 cm, while the cob diameter ranged between 3.50 cm to 8.10 cm with an average diameter of 6.40 cm. kernel rows per cob ranged between 10 to 18 rows with a mean of 14 rows per cob, while the kernel number per row ranged between 12 to 37 kernels per row with an average of 28 kernels per row. The shelling percent ranged from 75.0 to 82.5% with an average of 79%. The grain yield ranged between 42.4 g to 77.5 g with a mean yield of 61.20 g.
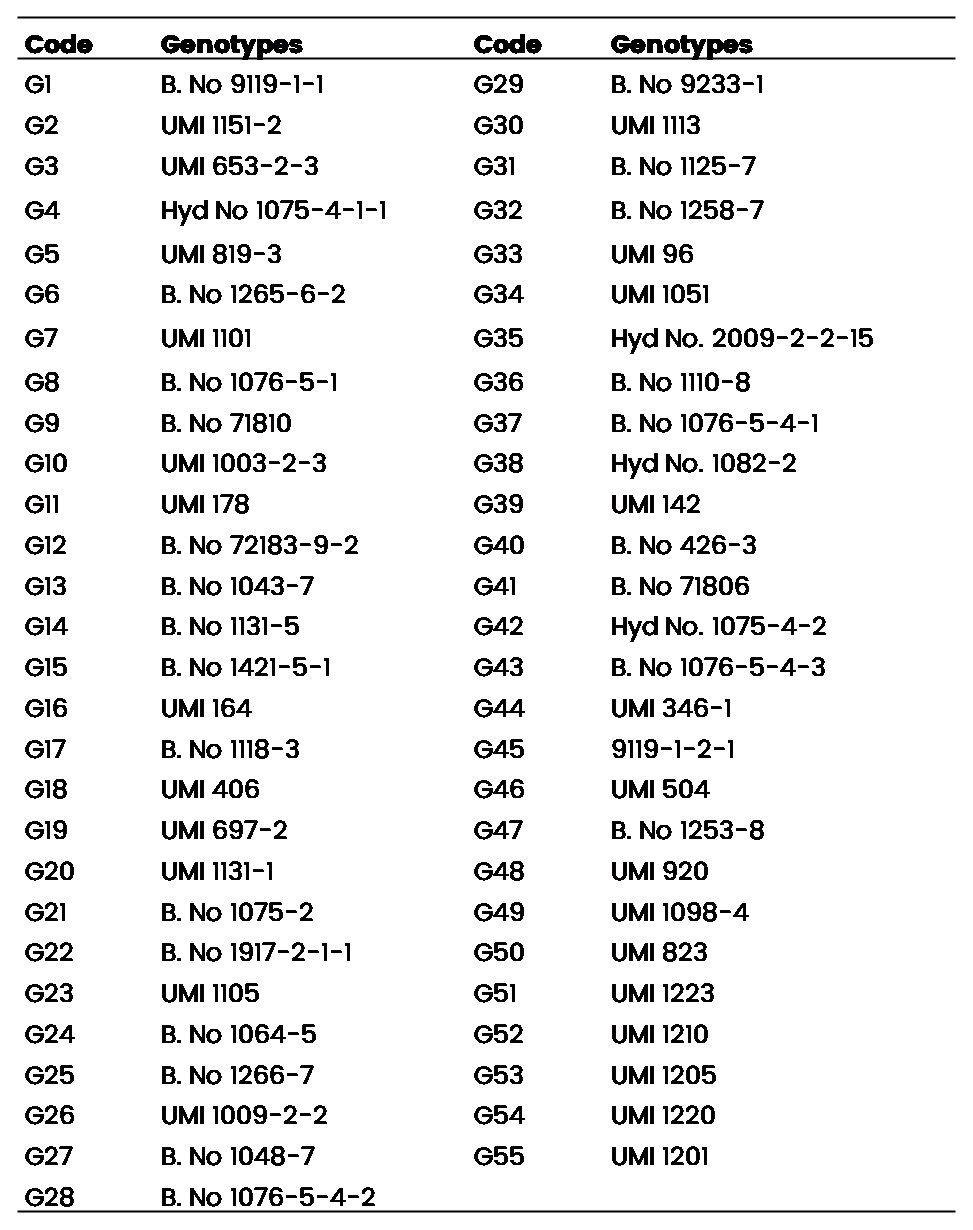
Table 1: List of 55 genotypes used under study
Genetic variability
The components of genetic variability such as phenotypic coefficient of variance (PCV), genotypic coefficient of variance (GCV), broad-sense heritability are given in Table 2 and discussed below.
Table 2: Best performing maize inbred lines for yield and yield attributing traits
Components of genetic variance
The Phenotypic coefficient of variance is higher than the genotypic coefficient of variance indicating the presence of environmental effect in the trait expression. Further, High values for both PCV and GCV were exhibited by kernel number per row. Kernel row number, grain yield, cob diameter, cob length and plant height exhibited moderate values for both PCV and GCV, while days to 50% tasseling, days to 50% silking and shelling percentage showed low PCV and GCV values. The magnitude of difference between the PCV and GCV estimates can be used to determine the amount of variance that occurs due to environment.
Broad sense heritability (h2bs) and Genetic Advance as percent of Mean (GAM)
Plant height, cob length, kernels per row and yield exhibited high heritability coupled with high genetic advance. Days to 50% tasseling, days to 50% silking exhibited high heritability with moderate GAM. Cob diameter and kernel row number exhibited moderate values for both heritability and genetic advance. While, shelling percentage exhibited low heritability and genetic advance.
Correlation
Correlation analysis for the traits studied revealed various significant trait associations (Fig. 1). Days to 50% tasseling and days to 50% silking showed high positive significant correlation between each other. Yield is a trait which is influenced by multiple dependent factors, hence an analysis of the trait association with the grain yield reveals the traits to be improved to achieve higher yields. Grain yield significant positive association with plant height, cob length, cob diameter, number of kernel rows, number of kernels per row. Hence selection for these traits can be utilized to improve grain yield.
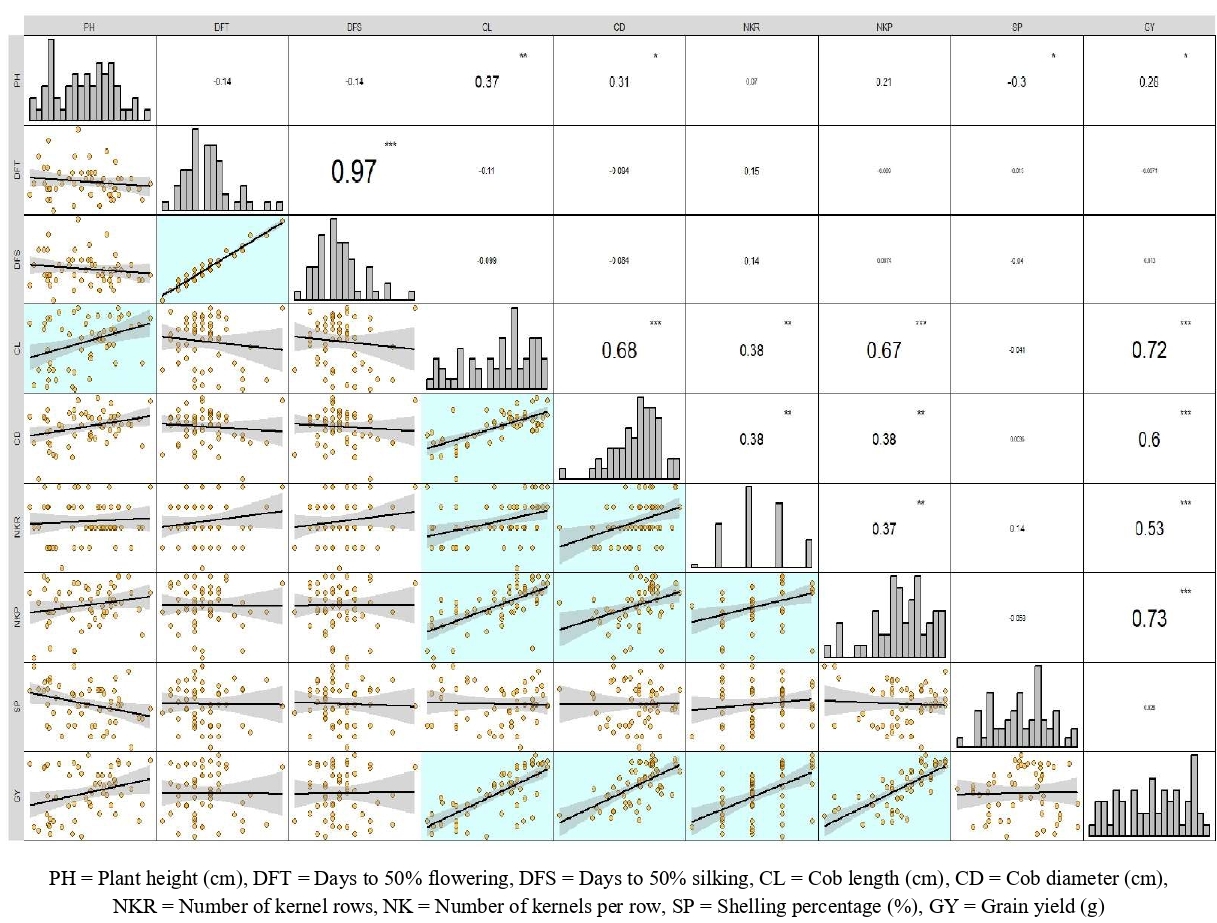
Fig. 1 Correlation analysis for all the nine traits under study
Principal component analysis
The principal component analysis method, established by Karl Pearson in 1901, is used to reduce the size of a data set into a number of components (Venujayakanth et al., 2017). The Principal Component Analysis (PCA) conducted in this study effectively partitioned the total variability into nine principal components, where three components displayed eigenvalues surpassing one, signifying their substantial contribution in explaining the dataset's variance as evidenced in the scree plot (Fig. 2). Collectively, these three principal components accounted for a noteworthy 74.44% of the overall variance. Notably, the first PC emerged as the most influential, explaining 37.37% of the total variance, followed by the second (22.89%) and the third (14.17%) PCs. The identified trait contributions delineated distinct patterns: the first PC was characterized by traits associated with grain yield, cob characteristics, except number of kernel rows, while the second PC predominantly encapsulated flowering traits. The third PC prominently featured shelling percentage and plant height, elucidating their influence on this component. The trait number of kernel rows was the major contributor for the variance explained by PC6 (Fig. 2).
PCA biplot exhibits the relation between the traits and between the genotypes (Fig. 3). The acute angle between two traits reveals the positive association between them, while an angle >90° indicated negative association. The flowering traits are in high positive correlation with each other, while the yield and cob traits such as cob length, cob diameter, kernel row number, kernels per row showed positive associations amongst them. Based on their scatter position on the biplot, the genotypes UMI 1003-2-3 (G10), B. NO 1421-5-1 (G15), B. NO 1917-2-1-1 (G22), G3, B. NO 1125-7 (G31), UMI 920 (G48) are placed the farthest in the biplot indicating the diverse nature of these genotypes.
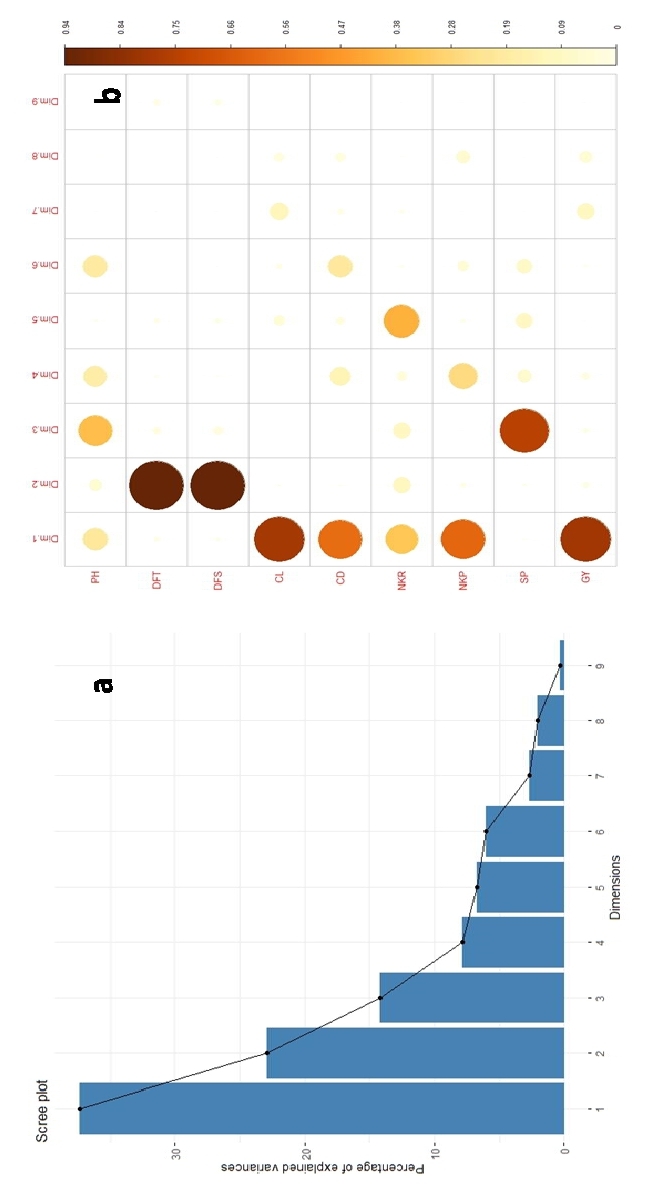
Fig. 2 (a) Scree Plot for all principal components and (b) contribution of different traits to the variance explained by each principal component
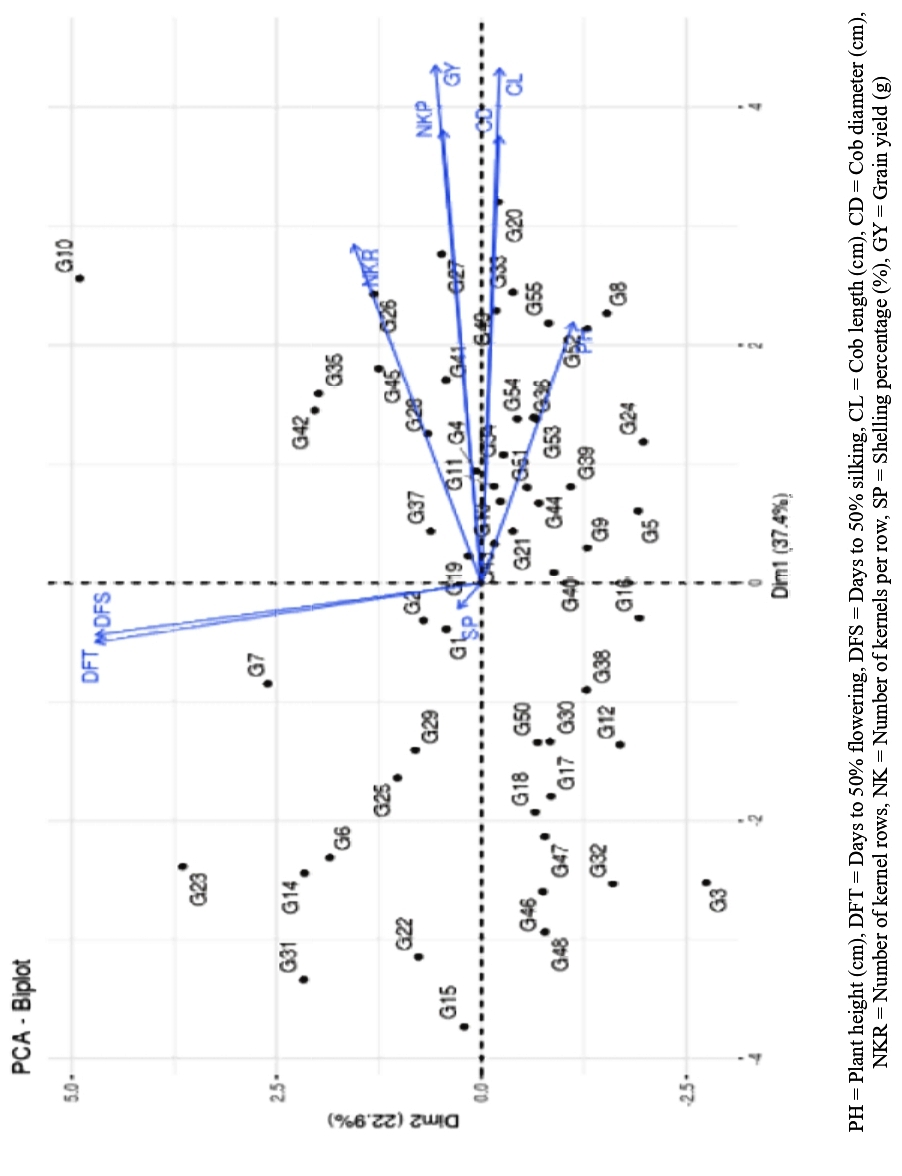
Fig. 3 PCA Biplot for both traits and Genotypes
Multi trait Genotype Ideotype Index
Initially two ideotypes were defined with varying maturity i.e. medium and late, maturing with high yield. The MGIDI distances to selected genotype were calculated with respect to each ideotype. A selection intensity of 15% is opted for the selection criteria (Fig. 4).
Medium maturing ideotype
The selection gains (Table 3) were positive for all the traits with kernels per row having the highest gain at 18.60% followed by grain yield 18.30%, cob length (14.80%). Shelling percentage has the least gains at 0.07%. Cumulative selection gain was recorded at 70.21%. Eight genotypes were selected at 15% SI, which are B. NO 1265-6-2 (G8), UMI 1210 (G52), UMI 96 (G33), UMI 1201 (G55), UMI 1098-4 (G49), B. No 1110-8 (G36), B. NO 1064-5 (G24), UMI 1205 (G53). The genotype B. NO 1265-6-2 (G8) was the closest with least MGIDI value of 1.10 followed by UMI 1210 (G52) (1.59), UMI 96 (G33) (1.69) (Table 3).
Late maturing ideotype
All the traits showed positive selection gains (Table 3) ranging from 18.80% for Kernel number to 0.03% for shelling percentage, except for plant height which showed a negative selection gain (-5.31). A cumulative selection gain was recorded at 69.06% and a negative selection gain of -5.31%. Similarly, eight genotypes were selected based on SI of 15% UMI 1003-2-3 (G10) HYD NO. 2009-2-2-15 (G35), UMI 1009-2-2 (G26), Hyd No. 1075-4-2 (G42), B. NO 1048-7 (G27), B. NO 1076-5-4-2 (G28), 9119-1-2-1 (G45), B.NO1076-5-4-1 (G37) with UMI 1003-2-3 (G10) having the closest resemblance to the proposed ideotype based on its MGIDI values (0.71) (Table 3).
Table 3: Factor analysis and Multi Trait Genotype Ideotype Distance Index for two ideotypes
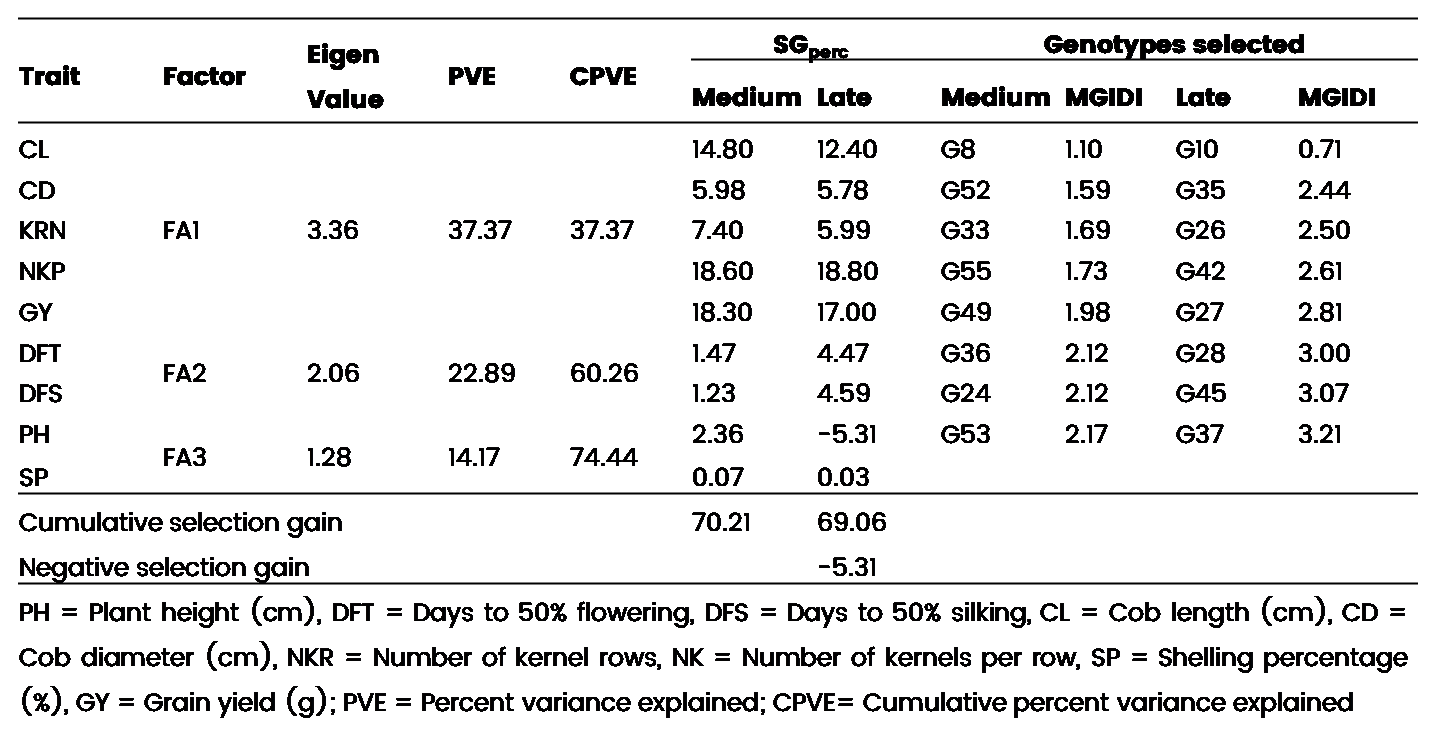
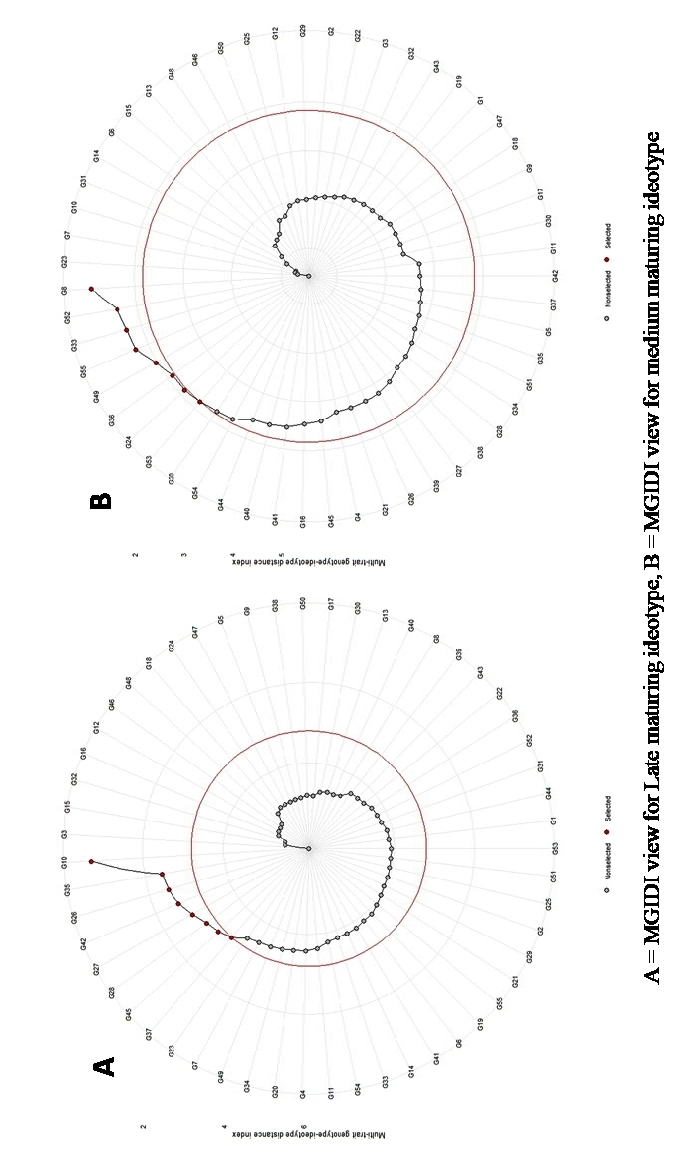
Fig 4. Multi Trait Genotype Ideotype Distance Index for late and medium maturing ideotypes
Strength and Weakness view of selected genotypes
The radar plot depicts the strength and weaknesses of the selected genotypes for various maturity periods are visualized (Fig. 5). Smaller proportions explained by a factor that is placed closer to the external edge indicate that the trait within that factor is more similar to the ideotype (Singamsetti et al., 2023). A view on strength and weakness under medium maturity showed that the genotypes B. NO 71806 (G41) and G56 showed strengths related to factor 1 which holds yield and yield attributing traits, whereas B. NO 1064-5 (G24) and B. NO 1265-6-2 (G8) showed strengths for the factor 2 which holds flowering traits (DFT, DFS), and UMI 96 (G33), UMI 1098-4 (G49), B. NO 1265-6-2 (G8) showed strengths in factor 3 which holds SP and PH.
Similarly, for late maturity, the genotypes 9119-1-2-1 (G45) and B. NO 1048-7 (G27) showed strength in FA1, while UMI 1003-2-3 (G10) showed strength in FA2 and B. NO 1076-5-4-1 (G37), B. NO 1076-5-4-2 (G28), and UMI 1009-2-2 (G26) showed strength in FA3.
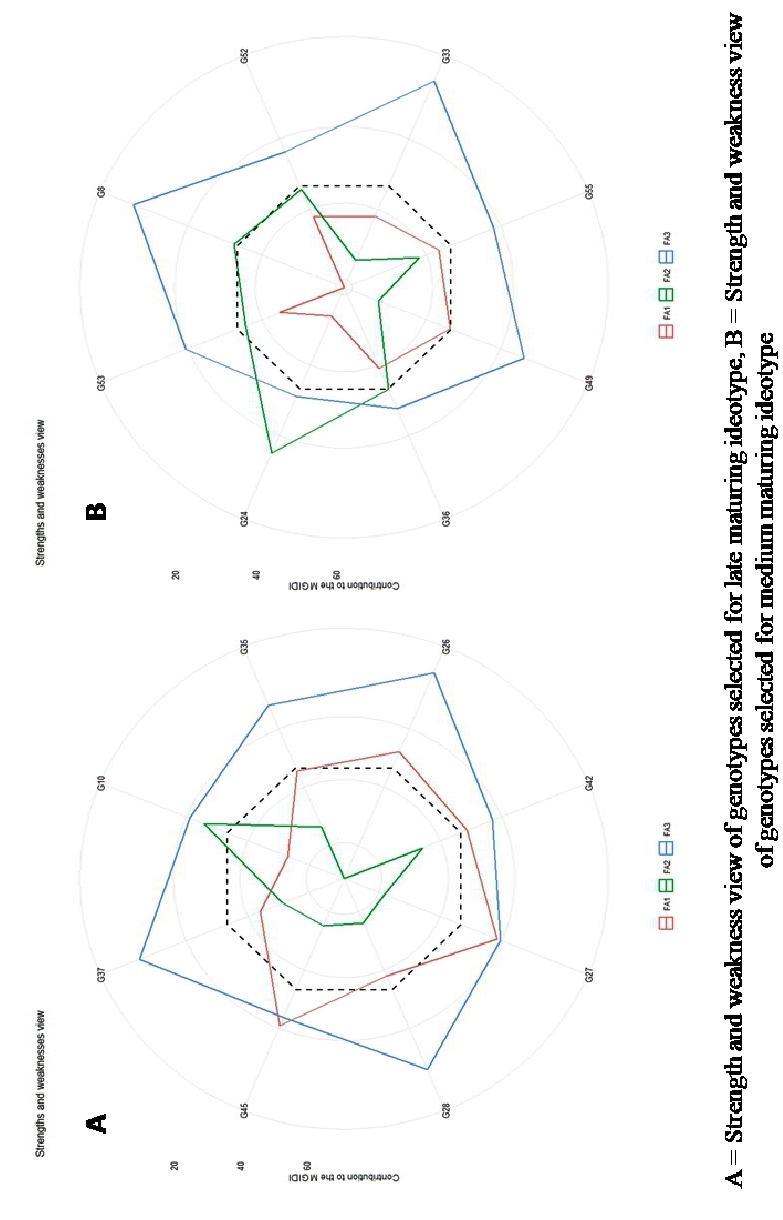
Fig 5. Strength and Weakness view of genotypes selected for late and medium maturing ideotype
Discussion
A successful maize breeding program relies on the amount of genetic variability present in the available germplasm. Wider presence of genetic variability aids in selection of desirable genotypes. The estimates of PCV and GCV explain the amount of variation present as expressed by either the genotype or the environment. In this study, high values for both PCV and GCV were exhibited by kernel number per row. Kernel row number, grain yield, cob diameter, cob length and plant height exhibited moderate values for both PCV and GCV. The magnitude of difference between the PCV and GCV estimates can be used to determine the amount of variance that occurs due to environment. Similar results were reported by other researchers (Netaji et al., 2000; Nagabhushan et al., 2011; Kapoor and Batra, 2015; Kandel et al., 2018; Prakash et al., 2019).
Estimates of genetic variability coupled with heritability and genetic advance estimates aid us in selection and improvement programs to obtain desirable genetic gains (Swarup and Chaugle, 1962). The values of heritability and genetic advance as mean, together can be used to determine the mode of gene action that is underlying the expression of the particular trait. A high heritability and GAM value indicate additive gene action, while a high heritability and low GAM percent indicate non-additive gene action. Low heritability and high GAM values indicated additive gene action but the heritability value could be due to environmental influence. Low heritability and GAM values show non additive gene action and also the prevalence of environmental influence in the manifestation of the character under study. In this study, traits like plant height, cob length, kernels per row and yield are influenced by additive gene action, so selection for improvement of these traits can be followed for achieving desired gains. Shelling percentage based on its heritability and GAM values, it can be deduced that the underlying gene action controlling its expression is of non-additive type. (Nagabhushan, 2011; Sofi et al., 2007; Panwar et al., 2013; Rahman et al., 2017) reported similar results for these traits.
Traits that contribute to yield are termed as yield attributing traits and these are generally in positive association with the yield. Positive, significant and high associations can be observed between cob length, cob diameter, number of kernel rows, and number of kernels per row with yield (Rafiq et al., 2010; Munawar et al., 2013; Lakshmi et al., 2018; Rai et al., 2021). Hence, selection for improvement of these traits can be used to achieve yield improvement.
The study utilized Principal Component Analysis (PCA) to decompose total variability into nine components, where three components, accounting for 74.44% of variance, exhibited eigenvalues >1. Trait contributions highlighted distinct patterns: PC1 correlated with grain yield, cob traits; PC2 predominantly linked to flowering traits, while PC3 emphasized shelling percentage and plant height while the variation captured by PC6 was explained by number of kernel rows. The similar work has been done by (Okporie, 2008; Iqbal et al., 2015; Bhusal et al., 2016). Varimax rotation reinforced the 'number of kernel rows' association with PC1. High communality values (98% to 53%) indicated substantial collective variance explanation for traits. The placement of the genotypes far from the origin revealed their diversity compared to other genotypes. The genotypes UMI 1003-2-3 (G10), B. NO 1421-5-1 (G15), B. NO 1917-2-1-1 (G22), G3, B. NO 1125-7 (G31), UMI 920 (G48) were placed in the either extremes of the biplot, hence explaining their diverse nature. The genotypes can be employed for their utilization in breeding programs.
The identification of medium and late maturing genotypes is crucial for producing hybrids preferred in specific Indian regions, emphasizing the importance of selecting genotypes with targeted traits in breeding programs. The MGIDI index offers a clear and effective selection method with practical applications for long-term genetic improvement. Assessing strengths and weaknesses using this approach provides a valuable tool to pinpoint areas for trait enhancement, distinguishing it from other indices. For instance, genotype UMI 1003-2-3 (G10) excels in flowering traits aligning with the proposed late maturing ideotype, while B. NO 1265-6-2 (G8), despite underperforming in flowering traits, suggests potential for improving yield traits while maintaining medium maturity. This approach was utilized by (Klein et al., 2023; Shirzad et al., 2022; Palaniyappan et al., 2023; Lima et al., 2023) in different crops to select genotypes that closely resemble the ideotypes suited for their breeding objective.
Conclusion
The presence of genetic variability is a requisite for any successful breeding program. Successful exploitation of the available genetic variability depends on the efficiency of selection based on the breeding objectives. Genotypes UMI 1009-2-2, UMI 1131-1, B. No 1048-7, B. No 1076-5-1, UMI 96, B. No 1110-8, 9119-1-2-1, Hyd No. 2009-2-2-15, UMI 1210 showed higher yield amongst other genotypes. Assessment of the association of traits provides an understanding, on trait interrelationships which can aid in further improvement. Every breeding objective has an ideotype around which the objective is focused on. Selection for single traits may increase the gains of that particular trait, but in process there is a chance of overlooking complex interactions between the studied traits. MGIDI is a comprehensive approach which enables simultaneous selection of genotypes based on multiple traits. Cumulative positive selections gains obtained for medium maturing ideotype was 70.21%, while it was 69.06% for late maturing ideotype with grain yield and number of kernels per row contributing the highest selection gains. Negative selection gains were observed in plant height for late maturing ideotype. At a selection intensity of 15%, 8 genotypes were selected which lie closer to the ideotype. Hence, utilization of a multi trait based selection index can enable effective selection of genotypes without any loss of variability.
Copyright
Open Access This article is licensed under a Creative Commons Attribution 4.0 International License, which permits use, sharing, adaptation, distribution and reproduction in any medium or format, as long as you give appropriate credit to the original author(s) and the source, provide a link to the Creative Commons license, and indicate if changes were made. The images or other third party material in this article are included in the article’s Creative Commons license, unless indicated otherwise in a credit line to the material. If material is not included in the article’s Creative Commons license and your intended use is not permitted by statutory regulation or exceeds the permitted use, you will need to obtain permission directly from the copyright holder. To view a copy of this license, visit http://creativecommons.org/licenses/by/4.0/.

