Effect of poultry production on air quality and human health in selected agricultural zones of Imo State
Abstract
The Confined Animal Feeding Operations (CAFOs) in poultry management are increasingly recognized as sources of air pollution, yet their health impacts remain underexplored. This study evaluated air pollutant levels and respiratory health among poultry workers in selected zones of the Poultry Association of Nigeria, Imo State, from December 2021 to May 2022. Air samples were collected monthly from six poultry pens across three zones. Pollutants measured included CO₂, CH₄, NO₂, NH₃, H₂S, SO₂, and PM₂.₅, alongside microclimatic parameters such as temperature, humidity, and wind speed. Gaseous pollutants were assessed using Kanomax and iTX multigas analyzers, and PM₂.₅ levels were measured with a pDR-1200 Monitor. A structured questionnaire and spirometry tests were used to evaluate workers’ health. Results showed mean NH₃ concentrations (2.22±1.67 ppm) exceeded FEPA limits, while PM₂.₅ levels (337.28±420.19 µg/m³) surpassed standards set by NESREA, WHO, and USEPA. CO₂, CH₄, NO₂, and SO₂ levels were within permissible limits. Relative humidity negatively influenced PM₂.₅ and most gases (p < 0.01), except NH₃. Wind speed had a significant negative effect (p < 0.10) on PM₂.₅, NO₂, NH₃, H₂S, and SO₂, while temperature negatively impacted CH₄, NO₂, and NH₃, but positively affected SO₂ and PM₂.₅. Health assessments revealed high prevalence of symptoms among workers, including headache (86.8%), tiredness (86.8%), nasal irritation (71.1%), and eye irritation (47.7%). Lung function tests indicated 10% of workers had obstructive patterns (FEV₁/FVC: 86.84±18.32%), while the control group had normal values (98.82±1.52%). PEFR was significantly lower in workers (61.12±27.85%) compared to controls (88.41±21.76%), with 13.3% showing severe airway narrowing. The study concludes that poultry farm air quality is poor and significantly impacts workers’ respiratory health, increasing their risk of lung function impairment and airway obstruction due to prolonged pollutant exposure.
Introduction
One major source of animal protein and a significant contributor to the Nigerian economy is poultry production, which is a subsector of livestock production and accounts for 19% of the country's meat supply (SAGTAP, 2012). The Nigerian poultry business, according to Sahel (2015), is projected to worth 80 billion ($600 million) with 165 million birds in it. With over 25 million people employed directly and indirectly in the commercial poultry industry, which has gradually grown from small backyard farms to large confined structures with intensive management systems. The poultry industry is considered to be the most industrialized segment of the livestock sub-sector (Bello et al., 2015). According to Adene and Oguntade (2006) and Abimiku (2008), the poultry industry in Nigeria is divided into small-scale (500-2,500), medium-scale (2,500-10,000) and large-scale (over 10,000 birds).
The expansion of poultry production resulting to Confined Feeding Animal Operations (CFAOs) is increasingly recognized as a source of air pollutants that have significant environmental and health impacts in and around poultry facilities (Copeland, 2014). This is mainly due to litter and manure generated during production, which pose a serious risk of air pollution arising from the emission of unpleasant odours and microorganisms. According to Akinbile (2012), harmful gas pollutants such as NH3, CO2, O3, N2O, and other gases are released and contribute between 3−8% to global warming, exacerbating the effects of climate change.
In poultry manure, 57% of the total nitrogen is lost via volatilization within 14 days of dumping (Adeoye et al., 2004). Ammonia volatilization can increase greenhouse gas emissions, generate acid rain, and suffocate people (McGinn and Janzen, 2018). According to Oguntoke et al. (2010), indoor air pollution causes a bigger health risk on a worldwide scale than contaminated outdoor air pollution does while a source of air pollution is the unregulated dumping of waste inside and outside the poultry pens. Toxic gases (NH3, CO2, and H2S), odours, dust, and microorganisms are found in poultry housing and are known to have a negative impact on poultry health.
Objectives of the Study
The overall objective was to assess the effect of poultry production on air quality and human health in selected agricultural zones of Imo State.
The specific objectives of this study were to
- Assess the gaseous and Particulate Matter pollutants from poultry production systems.
- Determine the microclimatic parameters from intensive poultry production systems and their effect on air pollutants;
- Assess the effects of air pollutants on the health status and lung function of poultry workers.
Material and Methods
Study area
The research area consisted of chicken farms in a few agricultural zones in Imo State, in the southeast of Nigeria. The State was established in February 1976 with 27 Local Government Areas (LGA) and 37 Local Council Development Areas (LCDA) as at the time of writing the reports. ImoState is located between latitude 5°29'0" north and longitude 7°2'0" east. The study area is bordered by Anambra State to the north, Rivers State to the south, Delta State to the west, and Abia State to the east. 4.93 million People live in the state, which has a land area of around 5530 km2 (NPC, 2006). The state experiences tropical weather with yearly rainfall ranging from 1600 mm to 900 mm. All year round, the area experiences warm temperatures. Temperatures in the area range from 28°C to 35°C all year round. Fig. 1 displays the map that depicts the sample at the study area of Imo state.
Sample collection and analysis
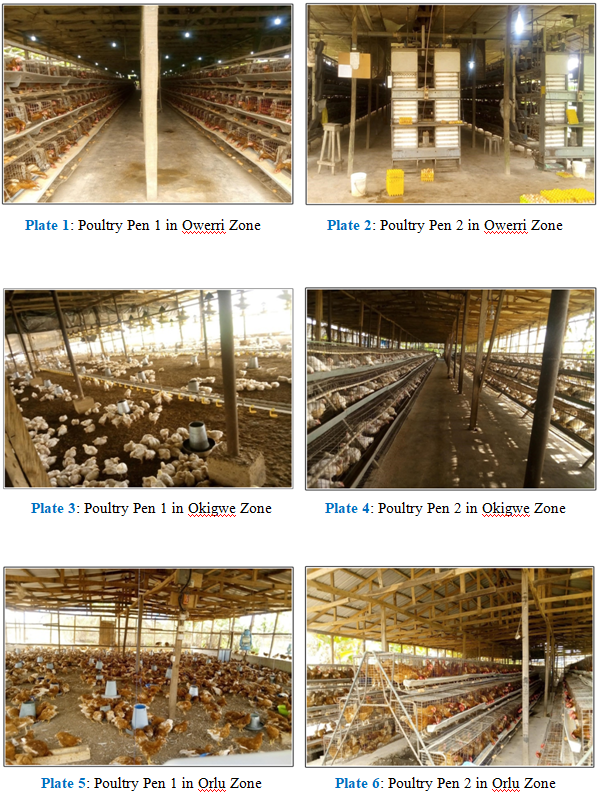
The Six poultry houses in three zones; Orlu, Okigwe, and Owerri, each marked by the letters R, K, and W as illustrated in Plates 1 - 6 were purposefully chosen from three poultry zones categorized by the Imo State-based Poultry Association of Nigeria (PANIS). Every month from December, 2021 to May, 2022, two poultry houses in each zone were sampled. These poultry houses passed both indoor and outdoor air sampling using the air sampler. In order to achieve a complete coverage of the surroundings for optimal coverage, both inside and outdoor air sampling spots were determined based on the air pollution levels in the poultry houses and population density of the poultry birds. Table 1 displays the parameters of the pens (W1, W2, K1, K2, R1 and R2) at the time of sampling. The sampled areas outside the pens are designated as W3, K3, and R3.
Thermo PDR 1250 metric sampler was used to detect PM2.5 while KanoMax and iTXmultigas Analysers, hand-held air quality monitoring devices, provided direct reading readings of NH3, CH4, N2O, H2S, and CO2 over the course of an hour at 10-minute intervals. The Kanomax gas analyzer's associated probe was used to acquire meteorological data such as temperature and relative humidity, while the Benetech Model GM816 multipurpose microprocessor digital anemometer was used to monitor wind speed. Monthly sampling was done between December, 2021 and May, 2022.
Study population
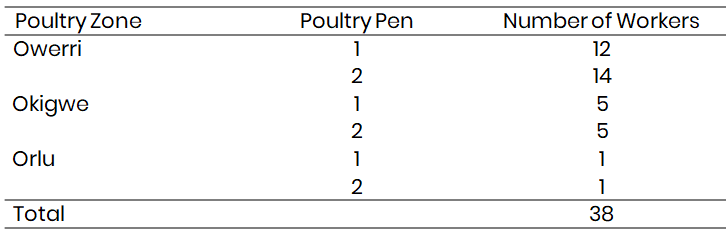
Clearly defined questions to ascertain the extent/level to which air pollution from the production of poultry affects people's health. In addition to asking for information on their personal judgment of their health. The purpose of choosing respondents, a purposive sample technique is doubtable. The whole workforce at the three poultry farms comprised the targeted respondents. The demographic distribution between the three poultry farms is shown in Table 2.
Impacts of air pollutants on the health status of poultry workers
Thirty-eight respondents which represented the total population of workers in the six sampled poultry pens were administered questionnaires and their responses documented.
Lung Function Assessment
A hand-held spirometer SP10 in accordance with the ATS standard, respiratory function parameters (FVC, FEV1, FEV1/FVC % and PEFR) were assessed (Miller et al., 2020). To help each respondent act appropriately, demonstration exercises of the maneuver were explained to them. Prior to the lung function testing, they were advised to practice this maneuver. Each subject was examined while seated. Each participant's mouthpiece was discarded, and air was forced through it into the spirometer to prevent contamination. The subjects were told to inhale deeply and quickly before exhaling fiercely and thoroughly into the apparatus. The highest FVC, PEFR, and FEV measurements obtained during the first one second were recorded after three readings.
Anthropometric characteristics
Each person from the control group and the poultry workers was questioned about their age in years. A portable stadiometer was used to measure the workers' heights and the weights were determined using a weighing scale.
Calculation of predicted values of FVC, PEFR and FEV
The observed FVC, PEFR, and FEV values were reported as a percentage of the expected values using regression analysis and a set of prediction equations for adults (Ingle et al., 2005; Reddy et al., 2014; Olujimi et al., 2016).
The following are the prediction equations: Poultry workers:
FVC (L) = 0.019H-0.015A-0.70
FEV1 (L) = 0.019H-0.012A-1.07
PEFR (L/Sec) = -0.008H-0.121A+8.45
Control group:
FVC (L) = 0.037H-0.014A-3.82
FEV1 (L) = 0.037H-0.015A-3.72
PEFR (L/Sec) = -0.002H-0.006A+6.46
Where,
H is height in cm
A is age in years.
FVC is Forced Vital Capacity
FEV1 is Forced Expiratory Volume in one second (1s)
PEFR is Peak Expiratory Flow Rate Litres per minutes (L/min)
Subjects with (FEV1/FVC) less than 70% were categorised as having an obstructive pattern of lung function defect (Ibhafidon et al., 2014; Lopez et al., 2014).
(ANOVA, t-test, and regression). In order to establish the association between the pollutants and microclimatic factors, the Duncan's Multiple Range Tests and t.test were employed to separate the means of the pollutant concentration variations. Equation (1) depicts the multiple regression model used by to ascertain the association between microclimatic factors and contaminants (Obayelu and Adeniyi, 2006; Nwagwu et al., 2012)
Y = a + x1b1 + + x2b2+ + x3b3 + e ----------------(1)
Where,
Y = Dependent variables NH3, CH4, N2O, H2S, CO2 and PM2.5
x = Independent variables:
x1 = relative humidity
x2 = temperature
x3 = wind speed
a = regression constant
b = regression coefficient
e = error term
Description of activities at studied poultry sites
This section indicates the concentrations of gaseous pollutants CO2, across the sampling locations from December, 2021 to May, 2022. W1, W2, K1, K2, R1, R2 represent pens while W3, K3 and R3 denote the sampled points outside the pen. Pen K1 and K2 had varying age of birds because broilers were only raised for 6 weeks and were restocked at intervals. K1, K2 and K3 were not sampled in January because there were no birds. Also layers in R2 were sold after three months of sampling and the pullets were transferred to the battery cage in February, as they had reached point of lay. About half of the birds were later sold, leaving R1 with no birds for the rest of the sampling months.
The results BDL = Below Detection Limit
DL: Detection Limit
Control NPPW: Non-Poultry Production Workers
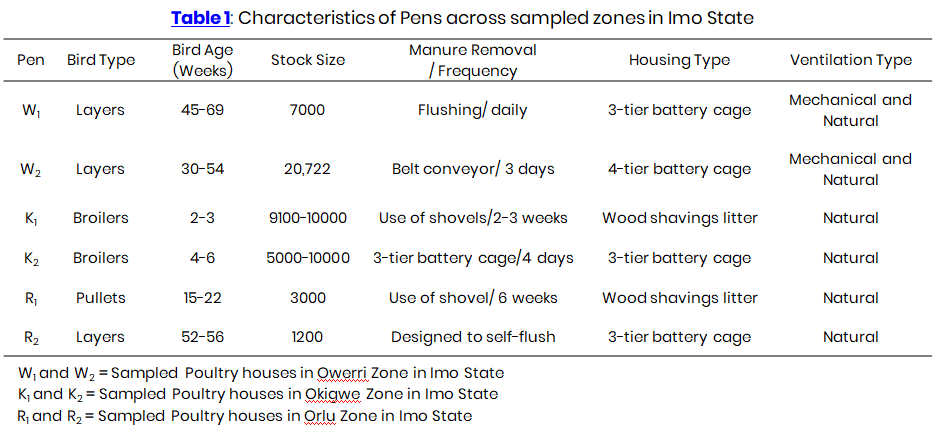
Table 2: Population distribution across the three poultry farms
Results and Discussion
Levels of CO2 pollutants from the studied poultry farms
Carbon dioxide (CO2) indoor concentrations (Mean±Standard deviation) ranged between 1041.33±32.25 and 1971.25±145.96 mg/m3 with the highest concentration W2 in the month of March and the lowest in W3 in January as shown in Fig. 2.

Fig. 2: Monthly variation of CO2 concentration at different locations
Mean concentrations of gaseous pollutants and PM2.5
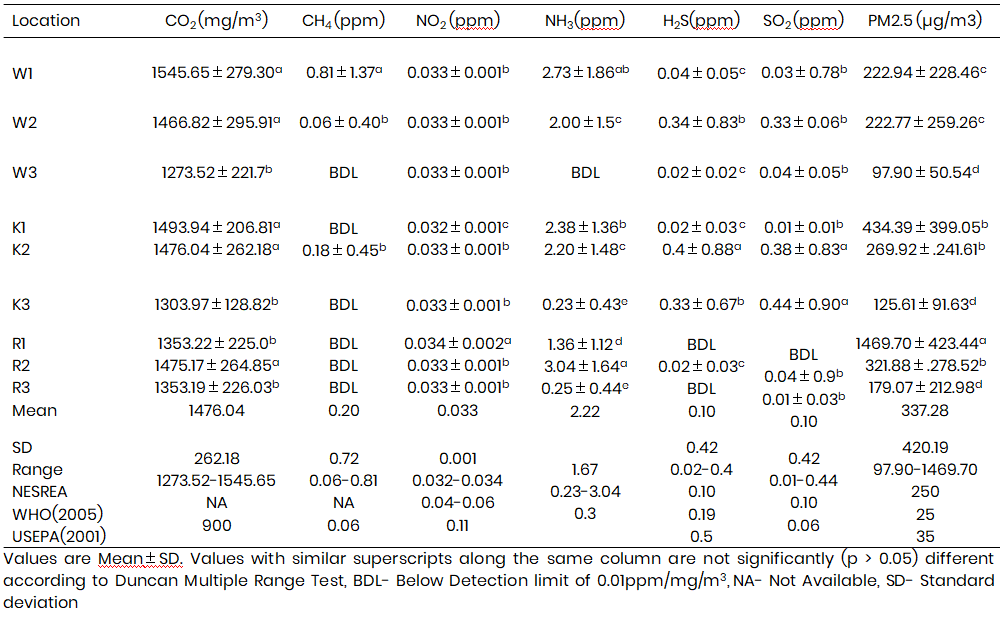
The summary of means of air pollutants are presented in the Table 3. Carbon dioxide (CO2) concentrations (Mean±Standard deviation) had a range between 1273.52±221.71 and 1545.65±279.30 mg/m3 with the highest at W1 and the lowest at W3 and were significantly higher in the pens. 3.
Methane (CH4) concentrations ranged from 0.06±0.40 to 0.81±1.37 ppm. The CH4 was however not detected W3, K1, K3, R1, R2, R3. The highest mean concentration was significantly highest in W1 and lowest in K2. The battery cage system operated in W1 allows collection of manure in slurry form in the pit which provides anaerobic condition resulting in CH4 production unlike manure in the solid form in R2.
Nitrogen dioxide (NO2) mean concentrations ranged between 0.032 and 0.034 ppm. The highest concentration was recorded in R1 and the lowest in K1. NO2 concentration was significantly highest in R1.
Ammonia (NH3) concentration ranged between 0.23±0.43 and 3.04±1.64 ppm. It was BDL in W3, lowest in K3 and significantly highest in R2. This may be attributed to the manure management practices. Manure is held back in R2for two weeks while the wastes from other battery cage pens are disposed within 2-3 days.
Hydrogen Sulphide (H2S) concentration ranged from 0.02±0.03 to 0.4±0.88 ppm. H2S was below detection limit in R1 and R3, lowest at R2 and significantly highest in K2.
Sulphur Oxide (SO2) concentration had a range of 0.01±0.01 and 0.44±0.90 ppm. It was BDL in R1, lowest in K1 and was significantly higher in zone K2 and K3 compared to others. This can be attributed to outdoor source of the emissions from the generator set of the farm which were in operation at the time of sampling.
Particulate Matter (PM2.5) concentrations ranged from 97.90±50.54 to 1469.70±423.44 µg/m3. It was lowest at W3 but was statistically highest in R2. This can be attributed to the poultry management systems. Pullets of 6 months were raised on litter (wood shavings and dust). This promotes behavioural expression of birds such as scratching and dust bathing. On the other hand, W1 and W2 had the lowest PM2.5 concentrations across the pens because both combined mechanical and natural ventilation while other pens have only natural ventilation. Hence, increase in air velocity helps to disperse pollutants, and reduce their concentrations as observed in W1 and W2.
Table 3: Mean concentrations of gaseous pollutants and PM2.5
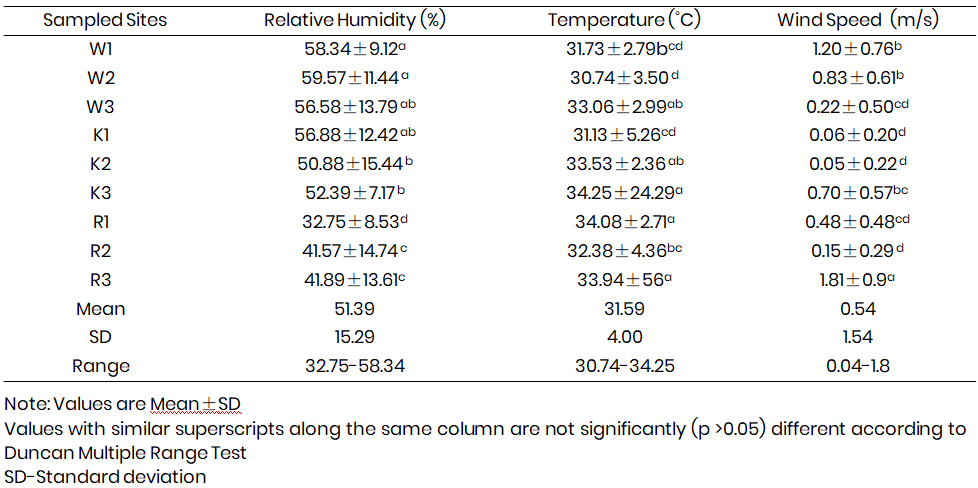
Mean values of the microclimatic parameters
Table 4 shows the summary of the mean values of microclimatic parameters of all the poultry sites.
The relative humidity (Mean±SD) ranged from 32.75±8.53 to 59.57±11.44%. The highest and the lowest RH were obtained in W2 and R1 respectively. W1 and W2 had significantly higher relative humidity than others.
Temperature (Mean±SD) values ranged between 30.74±3.50and 34.08±2.71 ˚C. The highest temperature was recorded at K3 and the lowest at W2. R1 and R2 had significantly higher temperatures than pens.
Wind speed (Mean±SD) ranges from the poultry sites were between 0.05±0.22 and 1.8±0.9 m/s. The highest wind speed was obtained at R3 while the lowest was at K2. This may be linked to low/still air movement since temperature was mostly high during sampling period. Pens W1 and W2 had significantly higher wind speed which can be attributed to the combination of both mechanical and natural ventilation system adopted compared to other pens.
Table 4: Mean values of microclimatic parameters in poultry sites
Discussion
The results of the values obtained in the pens are similar to that which was obtained in confined poultry houses in studies conducted by Oriola et al. (2013) in Ibadan, Oyo State and Zhao et al. (2015). However, NH3 levels recorded in most pens exceeded the limit of 0.3 ppm NESREA tolerance limit. H2S was however BDL in all poultry sites in December. These H2S concentrations were below that which was recorded by Nwagwu et al. (2011) in the poultry pens in Port Harcourt, Nigeria during the dry season. The H2S concentrations were however above the NESREA (2011) tolerant limits of 0.10 ppm in few pens (W1, W2 and K2), and also exceeded the WHO limits of indoor H2S (0.06 ppm). Sulphur dioxide (SO2) concentrations were BDL in the months of December and January in the sampled poultry site. Mean concentrations were however above NESREA (2011), WHO (2015) and USEPA (2011) air quality standard of 0.10 ppm, 0.19 ppm and 0.5 ppm respectively in pens K2, K2 and R2. High concentrations as clearly observed at K2 and K3 was also reported by Iyogun et al. (2018) who attributed the high concentration to combined outdoor and indoor sources of SO2. This can be linked to the emissions from the generator set of the farm which was in operation at the time of sampling. Concentrations of PM2.5 in most pens were above the recommended WHO (2015), USEPA (2011) and NESREA (2011) limits of 25 µg/m3, 35 µg/m3 and 250 µg/m3.
The high concentration in January can be associated with combination of dust generated in the poultry houses and harmattan dust. During the sampling in January, 2021, harmattan was quite severe; hence the prevalence of harmattan dust must have had its cumulative effect on the recorded PM2.5 concentrations. This supports the studies conducted on PM pollution in Nigeria during the harmattan period (Efe, 2008; Obioh et al., 2008).
Conclusion
The research confirms that poultry production has a significant negative effect on air quality and human health in selected agricultural zones of Imo State, Nigeria. Addressing this issue requires the cooperation and commitment of all stakeholders involved to implement sustainable practices and regulations that prioritize environmental conservation and human well-being.
References
Abimiku, A. E. (2008). Policy issues in livestock development in Nigeria. Jos: JAMB Press.
Adebowale, O. O., & Adeyemo, O. K. (2016). Work characteristics and occupational health hazards of poultry workers in Nigeria. African Journal of Environmental Science and Technology, 10(8), 258–266. https://doi.org /10.5897/AJEST2016.2119
Adene, D. F., & Oguntade, A. E. (2006). The structure and importance of the commercial and village-based poultry industry in Nigeria. Rome: FAO.
Adeoye, G. O., Shridar, M. K. C., & Mohammed, O. E. (2004). Poultry waste management for crop production: Nigerian experience. Waste Management and Resources, 22, 165–172.
Adeoye, G. O., Sridhar, M. K. C., Ogunwale, J. A., Makinde, E. A., & Ajayi, F. D. (2004). Evaluation of spent compost manure from mushroom production for crop improvement. Nigerian Journal of Horticultural Science, 9, 14–21.
Akinbile, C. O. (2012). Environmental impact of landfill on groundwater quality and agricultural soils in Nigeria. Soil and Water Research, 7(1), 18–26. https://doi.org/10.17221/8/2011-SWR
Bello, K. O., Alebiosu, L. A., Lala, A. O., Irekhore, O. T., & Oduguwa, O. O. (2015). Characteristics of commercial poultry and spatial distribution of metabolic and behavioural diseases in Oyo State, Nigeria. Journal of Veterinary Sciences, 13(3), 31–41.
Carruth, A. K., Carver, A., & Moffett, B. (2008). Personal protective equipment use among poultry workers in southern U.S. states. Journal of Occupational and Environmental Hygiene, 5(9), 611–616.
Copeland, C. (2014). Air quality issues and animal agriculture: A primer. Congressional Research Service. https://sgp.fas.org /crs/misc/RL32948.pdf
Copyright
Open Access This article is licensed under a Creative Commons Attribution 4.0 International License, which permits use, sharing, adaptation, distribution and reproduction in any medium or format, as long as you give appropriate credit to the original author(s) and the source, provide a link to the Creative Commons license, and indicate if changes were made. The images or other third party material in this article are included in the article’s Creative Commons license, unless indicated otherwise in a credit line to the material. If material is not included in the article’s Creative Commons license and your intended use is not permitted by statutory regulation or exceeds the permitted use, you will need to obtain permission directly from the copyright holder. To view a copy of this license, visit http://creativecommons.org/licenses/by/4.0/.

